Powernews Section Archive

UNIX Command of the Day Archive

Page 7 of 11
Stat: Querying Granular Inode Metadata, Auditing Sub-Second Filesystem Timestamps, and Inspecting Block Allocation in Production
UNIX COMMAND OF THE DAY

Stat: Querying Granular Inode Metadata, Auditing Sub-Second Filesystem Timestamps, and Inspecting Block Allocation in Production

It is 02:17 on a freezing Sunday morning when the pager alarm pierces your sleep. Heart pounding, you fumble across the bedside table in the dark, squinting against the blinding glare of a laptop screen where automated alerts are cascading in frantic red banners. A core database cluster servicing millions of live transactions has ground to an abrupt halt. Customer requests are timing out, message queues are stalling, and drowsy engineers on the emergency conference bridge are trading bewildered theories. When you log into the primary production node to diagnose the damage, standard monitoring displays an impossible contradiction: one dashboard screams that the root disk is at 100% capacity with zero bytes remaining, another insists that only 34 gigabytes of a two-terabyte volume are occupied, and every application attempting to write a single-line log entry crashes instantly.


⚡ 8,161 Tokens • $0.00 Cost
Split: Partitioning Multi-Gigabyte Data Dumps, Slicing Byte-Aligned Chunks, and Orchestrating Parallel Stream Ingestion in Production
UNIX COMMAND OF THE DAY

Split: Partitioning Multi-Gigabyte Data Dumps, Slicing Byte-Aligned Chunks, and Orchestrating Parallel Stream Ingestion in Production

It is 2:14 on a freezing Tuesday morning, and the urgent vibration of an on-call pager cuts through the silence of the bedroom. Bleary-eyed in the blue glare of a laptop terminal, you are met with every system administrator's recurring nightmare: the automated nightly replication pipeline has choked to a complete halt. A critical database snapshot has ballooned into an unmanageable 650-gigabyte monolith, stalled halfway across a transatlantic network connection because the cloud storage gateway unconditionally rejects any single-part upload larger than five gigabytes.

⚡ 8,446 Tokens • $0.00 Cost
Sort: Orchestrating Out-of-Core Data Sorting, Tuning In-Memory Buffers, and Parallelising High-Throughput Stream Pipelines in Production
UNIX COMMAND OF THE DAY

Sort: Orchestrating Out-of-Core Data Sorting, Tuning In-Memory Buffers, and Parallelising High-Throughput Stream Pipelines in Production

It is twenty minutes past three in the morning, and the piercing chime of an on-call pager cuts through the darkness. On your workstation screen, a sea of crimson dashboard alerts confirms the worst: an essential data pipeline has stalled, worker nodes are thrashing, and the Linux Out-Of-Memory killer has begun terminating vital background processes. Downstream services sit starved of events while dozens of gigabytes of unorganised server logs pile up into an impenetrable computational logjam.

⚡ 7,530 Tokens • $0.00 Cost
Slabtop: Auditing Kernel Memory Allocations, Triaging Dentry and Inode Cache Leaks, and Diagnosing Slab Exhaustion in Production
UNIX COMMAND OF THE DAY

Slabtop: Auditing Kernel Memory Allocations, Triaging Dentry and Inode Cache Leaks, and Diagnosing Slab Exhaustion in Production

The jarring chime of an on-call pager on a bedside table has a way of cutting through the deepest sleep. It is 2:14 on a Tuesday morning, and your primary database server is alerting that it has run out of memory. Bleary-eyed in the cold glow of your laptop screen, you SSH into the machine expecting to find a runaway query, a rogue background worker, or a bloated web server chewing through gigabytes of RAM.

⚡ 7,936 Tokens • $0.00 Cost
Setfacl: Managing Granular POSIX Access Control Lists, Enforcing Directory Inheritance Masks, and Securing Multi-Tenant Workloads in Production
UNIX COMMAND OF THE DAY

Setfacl: Managing Granular POSIX Access Control Lists, Enforcing Directory Inheritance Masks, and Securing Multi-Tenant Workloads in Production

It is 02:15 on a damp Tuesday morning when the pager goes off, jolting you awake to a glowing screen full of escalating red alerts. Your primary production services have suddenly ground to a halt inside a shared storage drive: the web server cannot read customer files, the background queue worker is crashing with permission errors, and in the incident Slack channel, a well-meaning colleague has just panicked and typed `chmod -R 777`. Seconds later, the automated compliance bot detects the wide-open permissions and freezes the entire cluster.

⚡ 8,347 Tokens • $0.00 Cost
Setcap: Granting Granular Linux Capabilities, Eliminating SUID Binaries, and Enforcing Least-Privilege Execution in Production
UNIX COMMAND OF THE DAY

Setcap: Granting Granular Linux Capabilities, Eliminating SUID Binaries, and Enforcing Least-Privilege Execution in Production

The harsh glow of a pager alert cuts through the bedroom darkness at 2:14 AM on a Tuesday. Your phone buzzes relentlessly against the nightstand, its vibration carrying the dreaded cadence of an automated critical incident: an anomaly has been flagged across three hundred production edge nodes, and the on-call channel is already cascading with frantic messages. Bleary-eyed and nursing a hastily brewed mug of coffee, you open the terminal to discover the nightmare scenario every systems administrator dreads. A routine telemetry daemon, running quietly in the background for three years to measure packet latency, has suffered a memory corruption crash—and because an engineer took an operational shortcut years ago to get the service running quickly, that single crash has just granted an attacker unchecked control over your entire server fleet.

⚡ 7,312 Tokens • $0.00 Cost
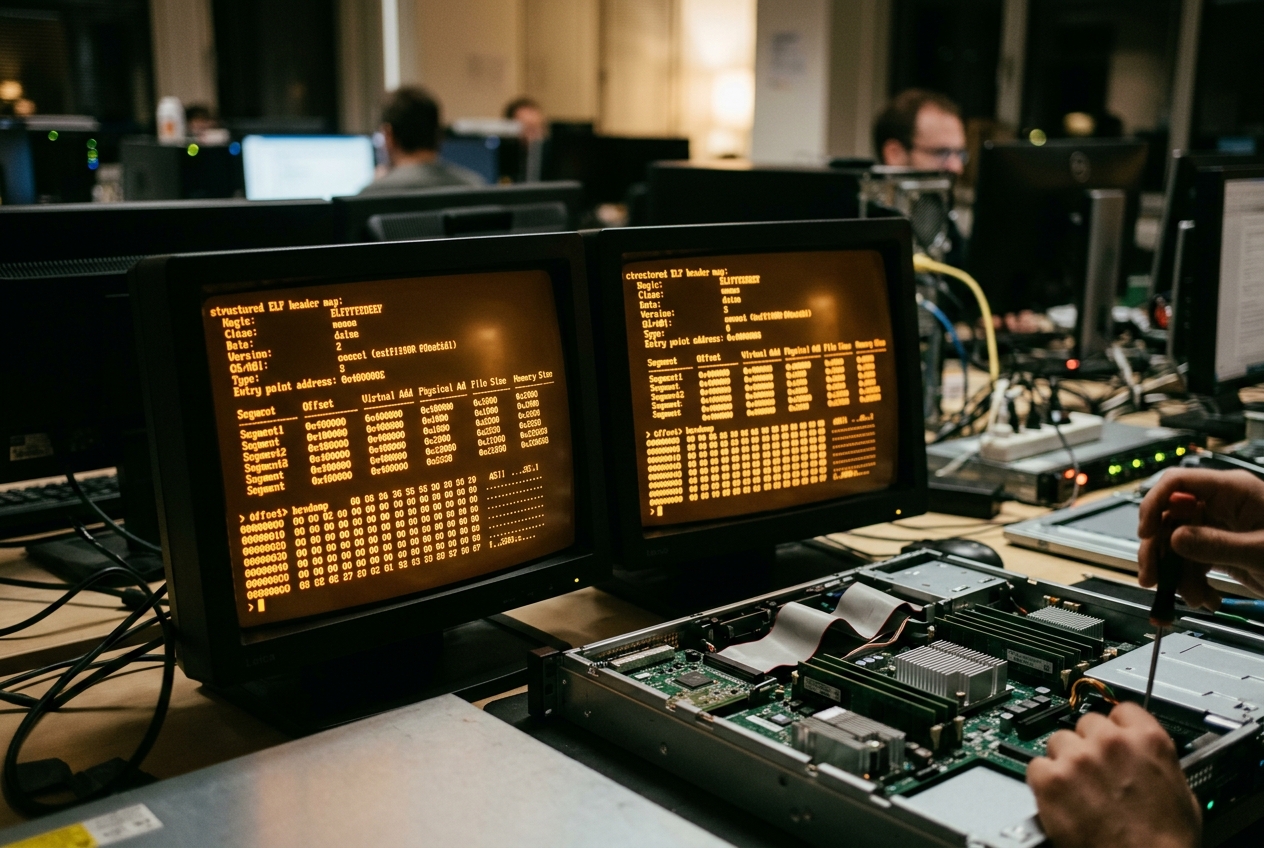
Readelf: Dissecting ELF Headers, Auditing Binary Hardening Protections, and Resolving Symbol Tables in Production
UNIX COMMAND OF THE DAY

Readelf: Dissecting ELF Headers, Auditing Binary Hardening Protections, and Resolving Symbol Tables in Production

The phone on your nightstand buzzes with the dread-inducing vibration that every on-call engineer recognises in their marrow. It is 02:14 on a Tuesday morning. An automated high-priority alert has just fired: the mission-critical payment worker service—pushed out twenty minutes earlier in a flurry of urgent hotfix commits—is crash-looping uncontrollably across your production Kubernetes cluster. The deployment dashboard glows an angry crimson, transaction queues are backing up by the second, and the incident channel is rapidly filling with bleary-eyed stakeholders demanding an immediate prognosis.

⚡ 8,783 Tokens • $0.00 Cost
Pv: Monitoring Pipe Data Throughput, Throttling Stream Bandwidth, and Diagnosing I/O Bottlenecks in Production
UNIX COMMAND OF THE DAY

Pv: Monitoring Pipe Data Throughput, Throttling Stream Bandwidth, and Diagnosing I/O Bottlenecks in Production

The pager shrieks at 02:40 on a cold Sunday morning. Your pulse spikes before your eyes even adjust to the glare of your monitor. The primary database cluster behind a financial clearinghouse has just suffered a catastrophic storage controller failure. To make matters worse, the secondary replica drifted out of synchronization hours earlier during a brief network hiccup, leaving your team with only one viable path to recovery: restoring a four-hundred-gigabyte transactional snapshot directly into a freshly provisioned cluster while millions of pounds in pending transfers hang in the balance. You type the restore command, press Enter, and wait.

⚡ 10,506 Tokens • $0.00 Cost
Pstree: Visualising Process Inheritance Hierarchies, Triaging Orphaned Daemon Subtrees, and Inspecting Container Process Topologies in Production
UNIX COMMAND OF THE DAY

Pstree: Visualising Process Inheritance Hierarchies, Triaging Orphaned Daemon Subtrees, and Inspecting Container Process Topologies in Production

The pager shatters the silence of a freezing bedroom at three in the morning. Your laptop screen flares to life, illuminating a bleary-eyed scramble against a crashing production server. Telemetry monitors are screaming that memory is draining away and CPU load is climbing steadily toward a total outage, yet when you frantically run standard monitoring tools, all you get is an unhelpful, thousand-line wall of raw numbers and disconnected process IDs. It is the digital equivalent of trying to navigate a sprawling city during a blackout using only a phone directory.

⚡ 8,200 Tokens • $0.00 Cost
Pgrep: Querying Process Substrings, Filtering Execution Namespaces, and Eliminating Pipeline Race Conditions in Production
UNIX COMMAND OF THE DAY

Pgrep: Querying Process Substrings, Filtering Execution Namespaces, and Eliminating Pipeline Race Conditions in Production

It is 02:14 on a freezing Tuesday morning, and the piercing chime of an on-call pager cuts through the stillness of your bedroom. On your laptop screen, the primary telemetry dashboard for your core payment-processing cluster has turned an alarming shade of amber, error alerts are cascading faster than you can scroll, and your pulse is quickening. Bleary-eyed and desperate to stop the bleeding before the morning rush of transactions begins, you open an emergency SSH session into the most heavily degraded server, faced with the high-stakes task of diagnosing a runaway backend service in the dead of night.

⚡ 7,408 Tokens • $0.00 Cost
Patch: Applying Unified Diffs, Orchestrating Atomic Hotfixes, and Automating Source Tree Reconciliation in Production
UNIX COMMAND OF THE DAY

Patch: Applying Unified Diffs, Orchestrating Atomic Hotfixes, and Automating Source Tree Reconciliation in Production

The glow of your monitor cuts through the dark at fourteen minutes past two on a freezing Saturday morning. Your phone has just shrieked you awake with a critical paging alert, and your pulse spikes before your feet even touch the floor. In the team chat room, messages are cascading in frantic red banners: an urgent remote security vulnerability in a core web component has been published with active exploits circulating in the wild, and your company's production servers are taking live traffic right now. The coffee on your desk is stone cold, your adrenaline is surging, and every passing minute risks sensitive customer data being siphoned away.

⚡ 9,842 Tokens • $0.00 Cost
Paste: Merging Line-Delimited Streams, Assembling Tabular Telemetry Records, and Reshaping High-Throughput Pipelines in Production
UNIX COMMAND OF THE DAY

Paste: Merging Line-Delimited Streams, Assembling Tabular Telemetry Records, and Reshaping High-Throughput Pipelines in Production

It is 02:14 on a freezing Tuesday morning. An automated severity-one pager alert jolts you awake with an abrasive buzz: the company's core payment gateway is failing, and incoming checkout transactions are dropping at an alarming rate. You scramble to your desk in the dark, squinting through bleary eyes at a wall of crimson monitoring alerts. Executive chat channels are already pinging with urgent status requests, customer complaints are mounting, and every passing minute means lost revenue.

⚡ 8,875 Tokens • $0.00 Cost
Parted: Manipulating GPT Partition Tables, Enforcing 4KiB Sector Alignment, and Resizing Dynamic Storage Volumes in Production
UNIX COMMAND OF THE DAY

Parted: Manipulating GPT Partition Tables, Enforcing 4KiB Sector Alignment, and Resizing Dynamic Storage Volumes in Production

It is 02:14 on a freezing Tuesday morning when the harsh, pulsing alarm of an on-call pager tears through the stillness of a dark bedroom. You reach blindly for your phone, wincing against the glare of the screen, only to find the emergency channel ablaze with red badges. The company’s core transactional database has suddenly ground to a dead halt, customer payments are failing across three continents, and the incident room is filling rapidly with anxious product managers demanding answers. Shivering at your desk, yesterday’s lukewarm coffee sitting neglected by your elbow, you stare at the flashing cursor of an SSH terminal. The pressure is suffocating: a multi-million-pound production service is frozen solid, and you are the only person standing between operational recovery and a catastrophic morning outage.

⚡ 8,105 Tokens • $0.00 Cost
Parallel: Orchestrating High-Throughput Concurrent Jobs, Managing Multi-Core Workload Queues, and Accelerating Production Batch Pipelines
UNIX COMMAND OF THE DAY

Parallel: Orchestrating High-Throughput Concurrent Jobs, Managing Multi-Core Workload Queues, and Accelerating Production Batch Pipelines

It is 2:47 on a freezing Tuesday morning, and the relentless buzz of an on-call pager cuts through the dark. On the other end of an SSH connection, an exhausted system administrator watches a terminal cursor blink with maddening indifference. A critical overnight batch of ten thousand customer database exports is due at 6:00 AM for the morning financial audit, but after three hours of crunching, the job is barely twenty per cent complete. The culprit is not a lack of computing power; the company recently spent tens of thousands of pounds on a cutting-edge server boasting 128 processor cores. Yet a glance at the activity monitor reveals an infuriating sight: core number one is screaming at 100% capacity, while the other 127 cores sit completely idle, drawing power and doing absolutely nothing.

⚡ 8,742 Tokens • $0.00 Cost
Objdump: Disassembling Executable Machine Code, Inspecting Section Relocations, and Auditing Binary Security in Production
UNIX COMMAND OF THE DAY

Objdump: Disassembling Executable Machine Code, Inspecting Section Relocations, and Auditing Binary Security in Production

The sharp buzz of an on-call phone cutting through the silence of a bedroom at two in the morning is a sound no engineer forgets. You stumble to your desk in the dark, blinking against the harsh glare of a laptop screen, only to find the incident channel overflowing with frantic messages: checkout services are failing across the board, customer orders are evaporating into thin air, and revenue is plummeting by the second. Your team is clustered on an emergency bridge call, exchanging theories in mounting disbelief, but nobody can say why the servers suddenly dropped dead.

⚡ 7,306 Tokens • $0.00 Cost
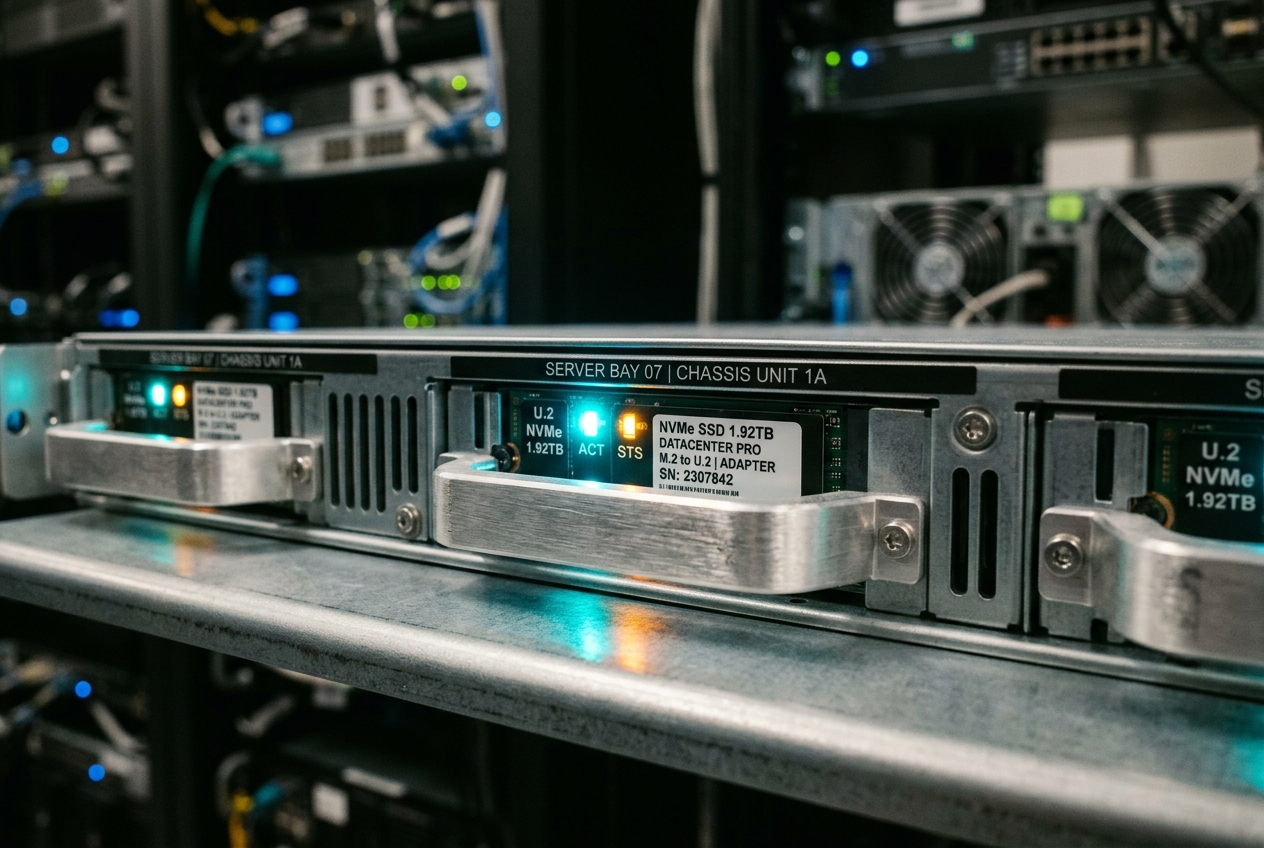
Nvme: Querying Controller Telemetry, Provisioning Storage Namespaces, and Auditing Solid-State Endurance in Production
UNIX COMMAND OF THE DAY

Nvme: Querying Controller Telemetry, Provisioning Storage Namespaces, and Auditing Solid-State Endurance in Production

Your phone buzzes against the bedside table at 2:34am with the persistent, rhythmic hum of an escalated PagerDuty alert. Bleary-eyed in the glow of a laptop screen, you dial into an emergency conference bridge where frantic engineers are trying to make sense of a critical database cluster that has ground to a dead halt. Thousands of customer transactions are queuing up, response times have surged from single-digit milliseconds into multi-second timeouts, and the executive incident channel is demanding an update before the financial markets open.

⚡ 8,567 Tokens • $0.00 Cost
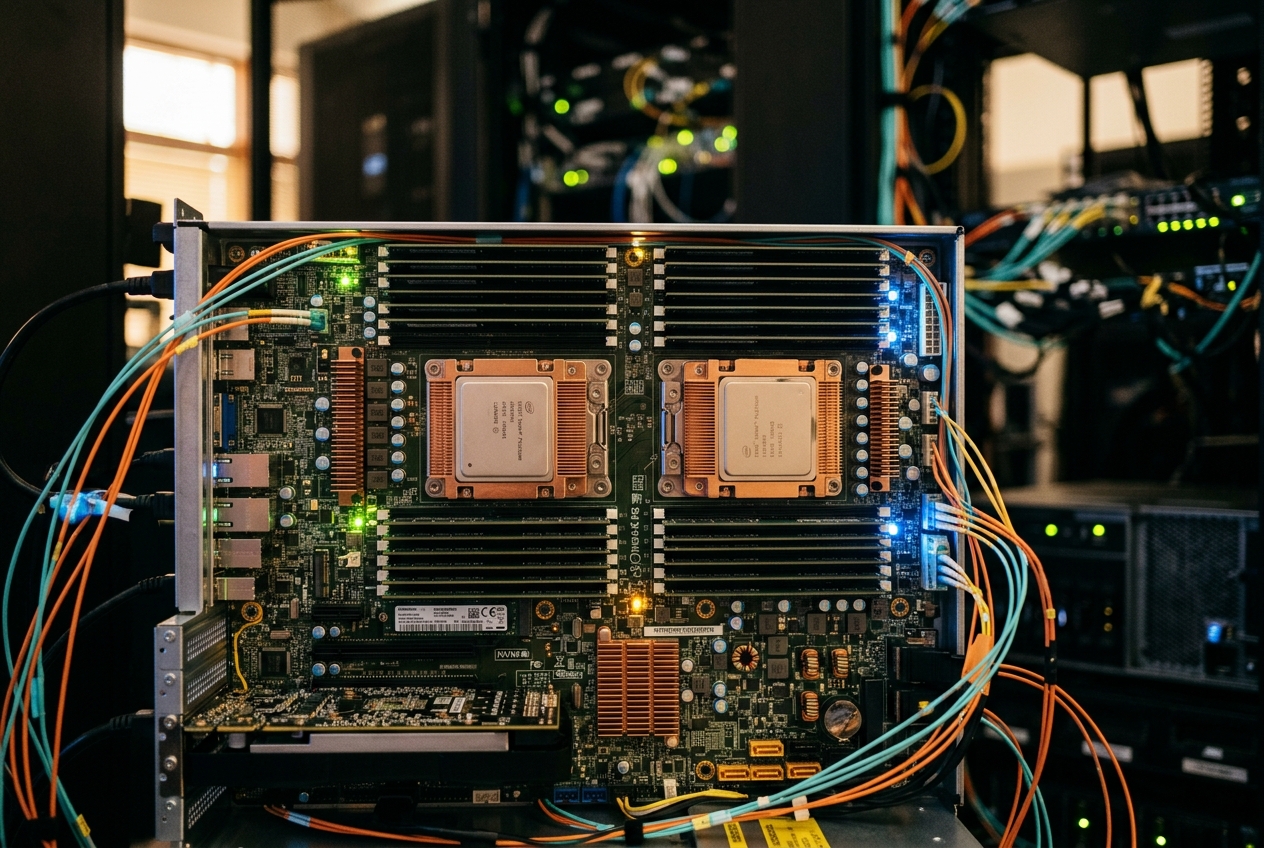
Numactl: Controlling NUMA Memory Policies, Eliminating Cross-Socket Bus Latency, and Optimising High-Throughput Workloads in Production
UNIX COMMAND OF THE DAY

Numactl: Controlling NUMA Memory Policies, Eliminating Cross-Socket Bus Latency, and Optimising High-Throughput Workloads in Production

The phone shrieking on your bedside table at 2:15 AM is every systems administrator’s quiet nightmare. You squint against the glare of a laptop screen, heart pounding, as the latency monitoring dashboard flashes an uncompromising, emergency crimson. The primary customer checkout service has suddenly ground to a crawl: database response times have ballooned from a crisp 250 microseconds to nearly ten milliseconds, transactions are timing out, and customer queues are backing up. Yet when you SSH into the primary server, everything looks bafflingly serene. Processor utilization sits comfortably at 32 percent, the network interfaces are idling, disk input/output is virtually non-existent, and more than 200 gigabytes of high-speed memory remains completely free. The machine appears practically on holiday, yet the application is choking to death.

⚡ 8,929 Tokens • $0.00 Cost
Nmap: Auditing Network Attack Surfaces, Validating Firewall Segmentation, and Fingerprinting Infrastructure Services in Production
UNIX COMMAND OF THE DAY

Nmap: Auditing Network Attack Surfaces, Validating Firewall Segmentation, and Fingerprinting Infrastructure Services in Production

It is 2.14am when the on-call pager shrieks on your bedside table. You stumble to your desk, squinting through the gloom at a laptop screen awash with crimson alerts: the primary database cluster is dropping heartbeats, application latencies have spiked from milliseconds to infinity, and automated container restarts are failing across three separate zones. Panic is already brewing in the incident Slack channel.

⚡ 8,118 Tokens • $0.00 Cost
Nft: Modernising Kernel Packet Filtering, Managing Atomic Rule Sets, and Enforcing High-Throughput Network Policies in Production
UNIX COMMAND OF THE DAY

Nft: Modernising Kernel Packet Filtering, Managing Atomic Rule Sets, and Enforcing High-Throughput Network Policies in Production

It is 02:14 on a Tuesday morning when the on-call pager shatters the quiet of the bedroom. Bleary-eyed and clutching a lukewarm mug of instant coffee, you stumble to your desk in the dark, blinking against the harsh glow of multiple monitors. The incident channel is in full meltdown: customer transactions are timing out, servers are grinding to a halt under an unexpected surge of traffic, and the company’s primary web gateway is unresponsive.

⚡ 8,837 Tokens • $0.00 Cost
Mpstat: Profiling Per-Core CPU Saturation, Auditing Hardware Interrupt Balance, and Triaging Multiprocessor Imbalance in Production
UNIX COMMAND OF THE DAY

Mpstat: Profiling Per-Core CPU Saturation, Auditing Hardware Interrupt Balance, and Triaging Multiprocessor Imbalance in Production

The piercing shriek of a pager cuts through the silence of the bedroom at 2:14 in the morning. Your company's primary payment gateway is shedding customer connections by the thousands, checkout latencies have exploded from forty milliseconds to twelve agonizing seconds, and frantic messages are piling up in the emergency response room. You stumble out of bed, wipe the sleep from your eyes, and bring up the infrastructure dashboard. What you see makes no sense: the central graph calmly reports a tranquil 12.5 percent aggregate CPU utilization across the 64-core fleet. Memory consumption is well within limits, disk queues are clear, and by every high-level health metric, the servers appear to be resting comfortably while your business burns down around them.

⚡ 9,931 Tokens • $0.00 Cost
← Previous Page Page 7 / 11 Next Page →