Nvme: Querying Controller Telemetry, Provisioning Storage Namespaces, and Auditing Solid-State Endurance in Production
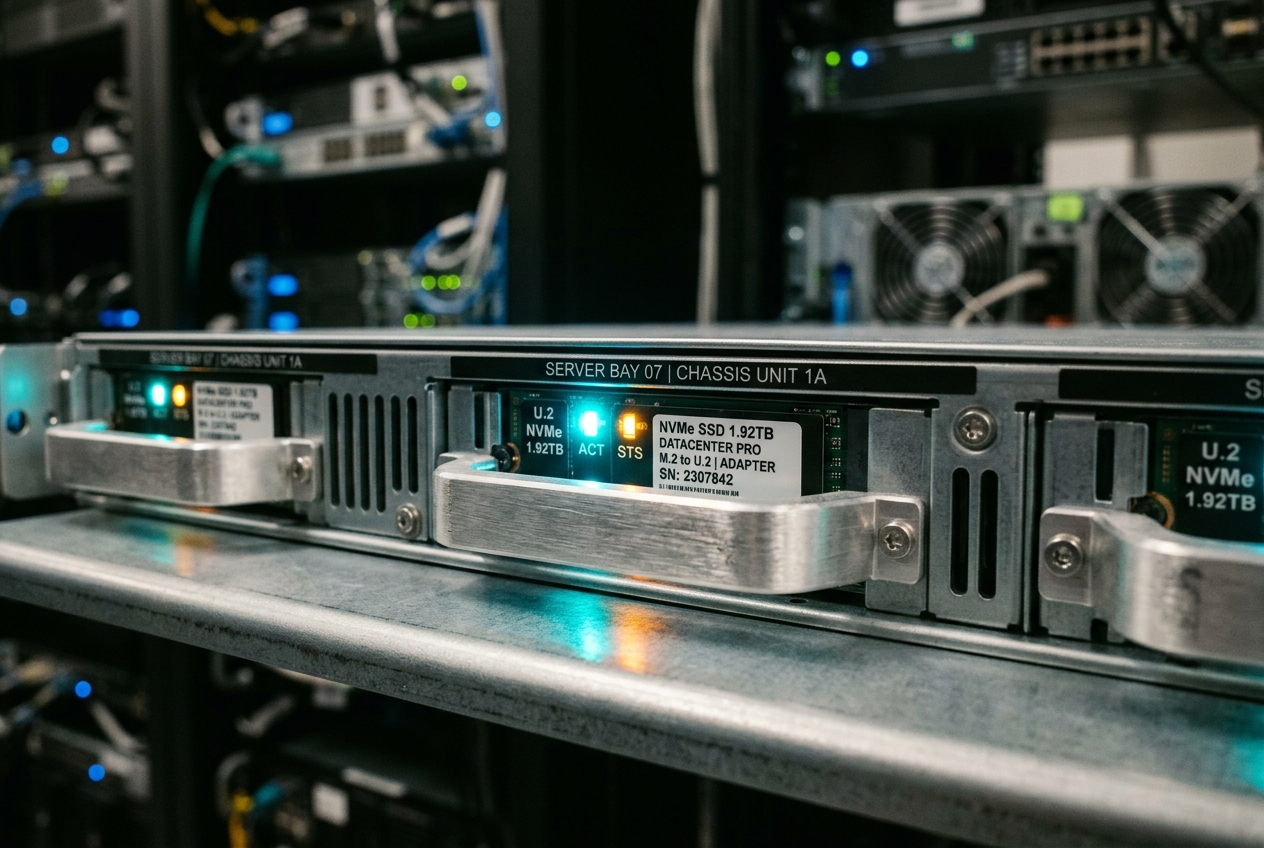
The usual diagnostic tools only deepen the confusion. Running iostat shows disk utilisation pinned stubbornly at 100%, vmstat lists dozens of worker threads trapped in unshakeable I/O wait states, and the CPU sits mostly idle waiting for storage that refuses to respond. Yet standard system checks insist the drive is online and healthy. The drive has not died in an obvious, clean crash; instead, it is quietly drowning behind the scenes—exhausting its spare memory blocks, frantically running internal garbage collection, and throttling its throughput because its internal silicon controller is overheating.
To solve the mystery, you have to stop treating modern solid-state storage like the spinning magnetic platters of twenty years ago. Modern enterprise solid-state drives attach directly to high-speed PCI Express lanes and communicate through the Non-Volatile Memory Express (NVMe) architecture. Operating systems normally hide this hardware complexity behind legacy block abstractions, but reaching inside the drive to inspect wear levels, temperature sensors, and flash endurance requires a specialised tool: nvme-cli, the standard Linux management suite that speaks directly to the storage controller.
Your first operational move during any storage incident is to query the system bus and inspect the live hardware topology:
# nvme list -o json
{
  "Devices": [
    {
      "NameSpace": 1,
      "DevicePath": "/dev/nvme0n1",
      "Firmware": "EPK7304Q",
      "Index": 0,
      "ModelNumber": "SAMSUNG MZQL23T8HCLS-00A07",
      "SerialNumber": "S64YNE0R102938",
      "UsedBytes": 3840755982336,
      "MaximumLBA": 7501476528,
      "PhysicalSize": 3840755982336,
      "SectorSize": 512
    }
  ]
}
In less than two seconds, nvme list reveals critical details that generic disk tools miss. The output confirms that controller /dev/nvme0 hosts namespace 1 at /dev/nvme0n1—an enterprise 3.84 TB Samsung drive running firmware EPK7304Q. Crucially, notice the SectorSize: 512 entry. The drive is currently emulating legacy 512-byte sectors rather than operating at its native 4096-byte (4KB) geometry. This structural mismatch forces the drive's internal translation layer to perform costly read-modify-write cycles on every incoming write, creating an immediate drag on transactional performance.
Understanding NVMe Architecture and the Linux Kernel
Under the hood, nvme-cli (invoked on the command line as nvme) provides a direct, low-overhead interface between Linux userspace and the non-volatile memory controller sitting on the PCI Express, Fibre Channel, or RDMA bus. Rather than routing storage traffic through legacy SCSI emulation layers, nvme interacts with storage using two distinct device nodes:
- Character Device Nodes (
/dev/nvme0): The administrative management interface. Used for firmware upgrades, deep health logging, hardware sanitisation, and namespace management. It represents the physical controller chip and cannot hold a filesystem. - Block Device Nodes (
/dev/nvme0n1): The storage data interface. Used for standard filesystems, database partitions, and application read/write I/O.
Admin & Control Plane"] NS1["/dev/nvme0n1 (Block Device)
Namespace 1 (Production)"] NS2["/dev/nvme0n2 (Block Device)
Namespace 2 (Multi-Tenant)"] end subgraph Bus["PCI Express Interconnect"] AdminIOCTL["Admin Commands (NVME_IOCTL_ADMIN_CMD)"] IOQueues["Submission / Completion Queues (Up to 64K Queues)"] end subgraph ASIC["Enterprise NVMe Controller ASIC"] QueueEngine["Hardware Queue Management Engine"] FTL["Flash Translation Layer (FTL)
Wear Leveling • Garbage Collection • Telemetry"] Sensors["Thermal Sensors & Crypto Engine (AES-256)"] FlashArray["NAND Flash Array & Dynamic Spare Blocks"] end Char --> AdminIOCTL --> QueueEngine NS1 --> IOQueues --> QueueEngine NS2 --> IOQueues --> QueueEngine QueueEngine --> FTL FTL --> FlashArray QueueEngine --> Sensors
Essential nvme Subcommands Reference
| Subcommand | Target Node | Primary Purpose | Real-World Application |
|---|---|---|---|
nvme list |
Global | Scans PCIe bus topology | Device inventory, serial discovery, sector sizing |
nvme smart-log |
Controller (/dev/nvme0) |
Dumps wear and sensor telemetry | Checking spare capacity, thermal throttling, NAND life |
nvme error-log |
Controller (/dev/nvme0) |
Reads internal controller error buffer | Isolating media uncorrectable errors from PCIe bus faults |
nvme id-ctrl |
Controller (/dev/nvme0) |
Inspects controller capabilities | Checking power loss protection, sanitize features, queue limits |
nvme id-ns |
Namespace (/dev/nvme0n1) |
Inspects namespace properties | Evaluating supported LBA formatting modes (512e vs 4Kn) |
nvme format |
Namespace (/dev/nvme0n1) |
Low-level sector formatting | Switching to native 4KB sectors or triggering crypto-erase |
nvme create-ns |
Controller (/dev/nvme0) |
Carves hardware namespaces | Slicing single SSD into multi-tenant, isolated hardware queues |
nvme sanitize |
Controller (/dev/nvme0) |
Hardware cryptographic purge | NIST SP 800-88 compliant decommissioning |
nvme telemetry-log |
Controller (/dev/nvme0) |
Captures ASIC diagnostic dump | Generating vendor diagnostic files for hardware RMA |
Five Real-World Production Use Cases
Use Case 1: Diagnosing Thermal Throttling and Flash Exhaustion via SMART Telemetry
Scenario
A primary PostgreSQL server suffers sudden, severe write stalls during peak daytime traffic. While standard Linux OS metrics show normal operating system health, you suspect the underlying NVMe drive is silently throttling due to thermal stress or running out of healthy spare memory cells.
Command
# nvme smart-log /dev/nvme0
Terminal Output
Smart Log for NVME device:nvme0 namespace-id:ffffffff
critical_warning                    : 0x04
temperature                         : 74 C
available_spare                     : 8%
available_spare_threshold           : 10%
percentage_used                     : 96%
data_units_read                     : 1,489,203,110
data_units_written                  : 2,891,402,994
host_read_commands                  : 19,401,920,441
host_write_commands                 : 48,102,940,119
controller_busy_time                : 42,910
power_cycles                        : 14
power_on_hours                      : 18,420
unsafe_shutdowns                    : 3
media_errors                        : 142
num_err_log_entries                 : 142
warning_temp_time                   : 128
critical_comp_time                  : 12
thm_temp1_trans_count               : 42
thm_temp2_trans_count               : 6
thm_temp1_total_time                : 840
thm_temp2_total_time                : 120
Temperature Sensor 1                : 74 C
Temperature Sensor 2                : 88 C
Temperature Sensor 3                : 61 C
Line-by-Line Technical Analysis
critical_warning: 0x04: A non-zero bitmask indicating an alert state. Bit 2 (0x04) signifies that theavailable_sparecapacity has dropped below the factory-configuredavailable_spare_threshold.temperature: 74 C&Temperature Sensor 2: 88 C: While the composite temperature reports 74°C, internal ASIC Sensor 2 is running at 88°C, exceeding safe operating margins and triggering severe hardware throttling.available_spare: 8%vsavailable_spare_threshold: 10%: The drive has consumed 92% of its factory reserve flash blocks to retire defective cells. It is now operating with virtually no margin for error.percentage_used: 96%: An official NVM Express endurance metric showing that 96% of the manufacturer-rated total bytes written (TBW) has been exhausted.media_errors: 142: The controller encountered 142 unrecoverable read or write errors where the Error Correction Code (ECC) engine failed to recover corrupted data.thm_temp1_trans_count: 42&thm_temp1_total_time: 840: The controller stepped down its processing clock 42 separate times to protect itself from burning out, degrading storage speed for a cumulative 840 seconds.
To verify whether these media errors represent bad silicon flash cells or transient PCIe bus interface faults, query the controller's internal error log:
# nvme error-log /dev/nvme0 -e 1
Error Log Entries for device:nvme0 entries:1
 Entry[ 0]
 .................
  error_count       : 142
  sqid              : 4
  cmdid             : 0x10a2
  status_field      : 0x281 (Unrecovered Read Error: The controller was unable to recover data from the media)
  parm_error_loc    : 0x28
  lba               : 0x14f8a00
  nsid              : 1
  vs                : 0
  trtype            : PCIe
The status field 0x281 confirms an Unrecovered Read Error at logical block address 0x14f8a00 originating directly from degrading NAND flash silicon rather than an electrical bus glitch.
What the Administrator Does Next
- Initiate an immediate application failover to promote a warm database replica.
- Flag
/dev/nvme0for urgent physical replacement (RMA) before the exhausted spare pool triggers a read-only hardware lock. - Review the chassis airflow, fan speeds, and heatsink mounting to resolve the 88°C hot-spot on Sensor 2.
Use Case 2: Optimising LBA Sector Formatting from 512-Byte Emulation to Native 4KB
Scenario
A high-throughput Ceph storage node exhibits high write amplification and disappointing random I/O performance. The underlying NVMe drive was provisioned using legacy 512-byte emulation (512e), forcing the drive controller to perform expensive Read-Modify-Write cycles for every standard 4KB filesystem operation.
Command
Query the namespace to inspect the available Logical Block Address (LBA) formatting modes supported by the hardware:
# nvme id-ns -H /dev/nvme0n1
Terminal Output
NVME Identify Namespace 1:
nsze    : 7501476528
ncap    : 7501476528
nuse    : 3120194816
nsfeat  : 0x0
nlbaf   : 2
flbas   : 0x0
mc      : 0x0
dpc     : 0x0
dps     : 0x0
nmic    : 0x0
rescap  : 0x0
fpi     : 0x0
dlfeat  : 1
LBA Format  0 : Metadata Size: 0   bytes - Data Size: 512 bytes - Relative Performance: 0x2 Good (in use)
LBA Format  1 : Metadata Size: 0   bytes - Data Size: 4096 bytes - Relative Performance: 0x0 Best
Line-by-Line Technical Analysis
nlbaf: 2: The namespace supports two distinct LBA formats (index0and index1).flbas: 0x0: Formatted LBA Size setting showing that Format Index0is currently active.LBA Format 0: 512-byte sector size marked asRelative Performance: 0x2 Good (in use). This legacy mode fractures 4KB host writes into eight individual 512-byte sector operations.LBA Format 1: 4096-byte (4KB) sector size marked asRelative Performance: 0x0 Best. This matches the native flash memory page size and Linux page cache boundaries, eliminating translation overhead.
To switch the drive to native 4KB sectors, execute a low-level format targeting LBA Format Index 1:
nvme format alters the physical sector geometry and instantly destroys all partition tables, filesystems, and data on the target namespace. Unmount all filesystems and double-check your target device node before running this command.# umount /mnt/ceph-osd-0
# nvme format /dev/nvme0n1 --lbaf=1 --force
Success formatting namespace:1
Confirm that the new 4096-byte sector configuration is active:
# nvme id-ns /dev/nvme0n1 | grep -E "^in_use|^flbas"
flbas   : 0x1
in_use  : 1
What the Administrator Does Next
- Create a native XFS filesystem aligned precisely to 4096-byte boundaries:
console # mkfs.xfs -b size=4096 -s size=4096 /dev/nvme0n1 - Mount the filesystem and run direct-I/O benchmarks with
fio. You will observe an immediate reduction in write latency and controller-level write amplification.
Use Case 3: Provisioning Isolated Hardware Namespaces for Multi-Tenant Workloads
Scenario
A bare-metal Kubernetes host requires strict I/O isolation between two distinct container workloads. Rather than using software-based Logical Volume Management (LVM)—which introduces kernel lock contention and CPU context switches—you carve a single enterprise NVMe drive into two distinct hardware namespaces with dedicated submission and completion queues.
Total Capacity: 3.84 TB"] NS1["Namespace 1: /dev/nvme0n1
Size: ~2.04 TB (500M 4KB LBAs)
Assigned: Production Database Pods"] NS2["Namespace 2: /dev/nvme0n2
Size: ~1.02 TB (250M 4KB LBAs)
Assigned: Multi-Tenant Analytics Pods"] Ctrl -->|Hardware Slice 1| NS1 Ctrl -->|Hardware Slice 2| NS2
Step 1: Detach and Delete the Monolithic Default Namespace
Ensure no filesystems are mounted from the drive, then detach and delete the existing factory namespace:
# nvme detach-ns /dev/nvme0 -n 1 -c 0
# nvme delete-ns /dev/nvme0 -n 1
delete-ns: Success, deleted nsid:1
Step 2: Verify Total Unallocated Controller Capacity
Check the total capacity (tnvmcap) versus unallocated capacity (unvmcap) on the controller:
# nvme id-ctrl /dev/nvme0 | grep -E "tnvmcap|unvmcap"
tnvmcap : 3840755982336
unvmcap : 3840755982336
The output confirms that the full 3.84 TB capacity is unallocated and ready for dynamic partitioning.
Step 3: Create Sliced Namespaces with Native 4KB Geometry
Create two separate namespaces by specifying size (--nsze) and capacity (--ncap) in 4096-byte blocks using LBA format index 1 (--flbas=1):
# nvme create-ns /dev/nvme0 --nsze=500000000 --ncap=500000000 --flbas=1
create-ns: Success, created nsid:1

# nvme create-ns /dev/nvme0 --nsze=250000000 --ncap=250000000 --flbas=1
create-ns: Success, created nsid:2
Step 4: Attach the Namespaces to Controller 0
Bind the newly provisioned namespaces to controller 0 (-c 0) so the Linux kernel can instantiate block device nodes:
# nvme attach-ns /dev/nvme0 -n 1 -c 0
attach-ns: Success, attached nsid:1

# nvme attach-ns /dev/nvme0 -n 2 -c 0
attach-ns: Success, attached nsid:2

# udevadm settle
# ls -l /dev/nvme0n*
brw-rw---- 1 root disk 259, 1 Oct 14 02:45 /dev/nvme0n1
brw-rw---- 1 root disk 259, 2 Oct 14 02:45 /dev/nvme0n2
What the Administrator Does Next
- Pass
/dev/nvme0n1and/dev/nvme0n2directly to container storage interfaces (CSI) or virtualization hypervisors. - Because each namespace uses dedicated hardware queues down to the controller chip, heavy write bursts on namespace 2 will not starve the queue depth or degrade response times on namespace 1.
Use Case 4: Extracting Endurance Group Logs and ASIC Telemetry for Vendor RCA
Scenario
A fleet of bare-metal servers used for high-frequency trading experiences sporadic I/O latency spikes of 200 to 500 milliseconds. Standard SMART telemetry shows zero media errors and normal temperatures. You must extract deep controller-level diagnostic dumps and endurance logs to submit to the hardware vendor's engineering team for root-cause analysis.
Command
Instruct the controller ASIC to take an instantaneous internal diagnostic snapshot and dump its raw SRAM debug buffer to a file:
# nvme telemetry-log /dev/nvme0 --host-generate=1 --output-file=/var/log/nvme0_telemetry_dump.bin
Submitting telemetry request...
Successfully wrote telemetry log data to /var/log/nvme0_telemetry_dump.bin (Size: 4194304 bytes)
Next, query the endurance group log to inspect write amplification across the flash memory channels:
# nvme endurance-log /dev/nvme0 -g 1
Terminal Output
Endurance Group Log for NVME device:nvme0 Group-ID:1
avl_spare                       : 100%
avl_spare_thres                 : 10%
percent_used                    : 14%
endurance_estimate              : 1,489,102,940,119,040 bytes
data_units_read                 : 89,140,290
data_units_written              : 142,940,102
media_units_written             : 398,802,884
Line-by-Line Technical Analysis
--host-generate=1: Instructs the controller to freeze and record its internal registers, translation cache lines, and error states at the exact microsecond of command execution.Size: 4194304 bytes: A standardized 4 MB binary diagnostic payload compliant with the NVM Express Base Specification.data_units_written: 142,940,102(~73.1 TB host writes) vsmedia_units_written: 398,802,884(~204.1 TB flash writes):
$$\text{Write Amplification Factor (WAF)} = \frac{\text{Media Units Written}}{\text{Data Units Written}} = \frac{398,802,884}{142,940,102} \approx 2.79$$
A Write Amplification Factor of 2.79 proves that the application's write pattern is forcing the Flash Translation Layer to constantly move and rewrite existing blocks during garbage collection, causing the 200–500ms latency spikes.
What the Administrator Does Next
- Attach
/var/log/nvme0_telemetry_dump.binto the vendor support escalation ticket. The manufacturer can inspect internal firmware state tables without requiring physical possession of the drive. - Increase application-level write buffering and adjust filesystem flush intervals to reduce random write fragmentation and bring the WAF down toward 1.0.
Use Case 5: Hardware Decommissioning via Cryptographic Media Sanitisation
Scenario
A production database server holding confidential customer data is being decommissioned and returned to an external hardware leasing provider. Standard disk formatting (mkfs) or file deletion leaves raw data recoverable through physical NAND flash analysis. You must sanitize the drive in full compliance with NIST SP 800-88 Rev. 1 Guidelines for Media Sanitization.
Step 1: Verify Hardware Sanitise Capabilities
Check the controller's sanitize capability register (sanicap):
# nvme id-ctrl /dev/nvme0 | grep sanicap
sanicap : 0x3
Bit 0x3 confirms hardware support for both Block Erase (a low-level voltage purge of flash cells) and Crypto Erase (instant destruction of the internal encryption key).
Step 2: Trigger Cryptographic Media Sanitisation
Issue the cryptographic erasure command directly to the controller:
# nvme sanitize /dev/nvme0 -a start-crypto-erase
Sanitize Operation Started successfully: action:start-crypto-erase
Step 3: Monitor Sanitisation Progress to Completion
Sanitisation executes inside the drive firmware independently of the host. Poll the sanitize status log until complete:
# nvme sanitize-log /dev/nvme0
Terminal Output
Sanitize Status Log for device:nvme0
Sanitize Progress                      (SPROG) : 65535 (100.00%)
Sanitize Status                        (SSTAT) : 0x101
Global Data Erased                     (GDE)   : 1
Number of Completed Passes             (NDP)   : 1
Estimated Time For Block Erase                 : 18 seconds
Estimated Time For Crypto Erase                : 2 seconds
Line-by-Line Technical Analysis
Sanitize Progress (SPROG): 65535 (100.00%): The internal state machine has finished erasing the encryption metadata across all flash channels.Sanitize Status (SSTAT): 0x101: Status code where the lower bits (001b) confirm successful completion, and bit 8 (1) confirms the Global Data Erased flag is active.Global Data Erased (GDE): 1: Hardware-certified guarantee that all user data across active blocks, over-provisioned spare blocks, and retired bad cells is mathematically unrecoverable.
What the Administrator Does Next
- Export the output of
nvme sanitize-logto an auditable compliance record. - The drive is now safe to unmount, unrack, and return to third parties in compliance with NIST SP 800-88 Purge standards.
Operational Hazards, Pitfalls, and How to Avoid Them
Hazard 1: Inadvertently Formatting Active Root Namespaces
Under high-stress triage, an engineer intending to format a secondary drive (/dev/nvme1n1) might accidentally target the operating system drive (/dev/nvme0n1).
# DANGEROUS: Wipes the active host operating system instantly
# nvme format /dev/nvme0n1 --lbaf=1 --force
Mitigation Protocol
Modern versions of nvme-cli block formatting on mounted volumes, but the --force flag overrides all protections. Always verify active mount points with findmnt or lsblk prior to formatting:
# lsblk -o NAME,MOUNTPOINT,SIZE,MODEL /dev/nvme*
In automated provisioning scripts, reference drives by persistent /dev/disk/by-id/ or PCI bus paths rather than dynamic kernel names (nvme0n1), which can re-order after a reboot.
Hazard 2: Device Node Confusion (Character vs. Block Nodes)
A common mistake is attempting to create a filesystem on the character device node (/dev/nvme0) or sending administrative controller commands to a block device node (/dev/nvme0n1).
# INCORRECT: Fails because /dev/nvme0 is an admin character node
# mkfs.xfs /dev/nvme0
mkfs.xfs: cannot open /dev/nvme0: Inappropriate ioctl for device
Remember:
* Use /dev/nvmeX for controller administration (id-ctrl, smart-log, sanitize, telemetry-log).
* Use /dev/nvmeXnY for storage I/O and filesystems (id-ns, format, mkfs, mount).
For detailed architectural references, consult the Debian Manpages for nvme(1) and the Linux Kernel NVMe Driver Documentation.
Hazard 3: Data Loss from Unprotected Volatile Write Caching (VWC)
Many consumer and entry-level enterprise SSDs use volatile DRAM write caches without battery-backed Power Loss Protection (PLP) capacitors. If power drops while data sits in DRAM, corruption is inevitable.
Inspect whether a volatile write cache is present on your controller:
# nvme id-ctrl /dev/nvme0 | grep -E "vwc"
vwc     : 0x1
If vwc is 0x1 and your server lacks redundant power supplies or enterprise-grade PLP capacitors, disable the volatile cache to ensure writes flush directly to persistent NAND:
# nvme set-feature /dev/nvme0 -f 0x06 -v 0
set-feature:06 (Volatile Write Cache), value:00000000
For more configuration examples and distribution-specific tips, refer to the ArchWiki NVMe Documentation.
Today's Takeaway
A modern NVMe solid-state drive is not a passive block device—it is a sophisticated, autonomous computer running high-speed microcontrollers, complex firmware algorithms, and sensitive flash silicon. Right now, open a terminal on your primary Linux server and run sudo nvme smart-log /dev/nvme0. Check your available_spare, scan for non-zero critical_warning flags, and inspect your temperature sensors. Taking five minutes today to audit your drive's internal health can save you from a catastrophic 2am outage tomorrow.