Turbostat: Auditing Hardware Power Envelopes, Profiling Processor C-State Residency, and Diagnosing CPU Thermal Throttling in Production
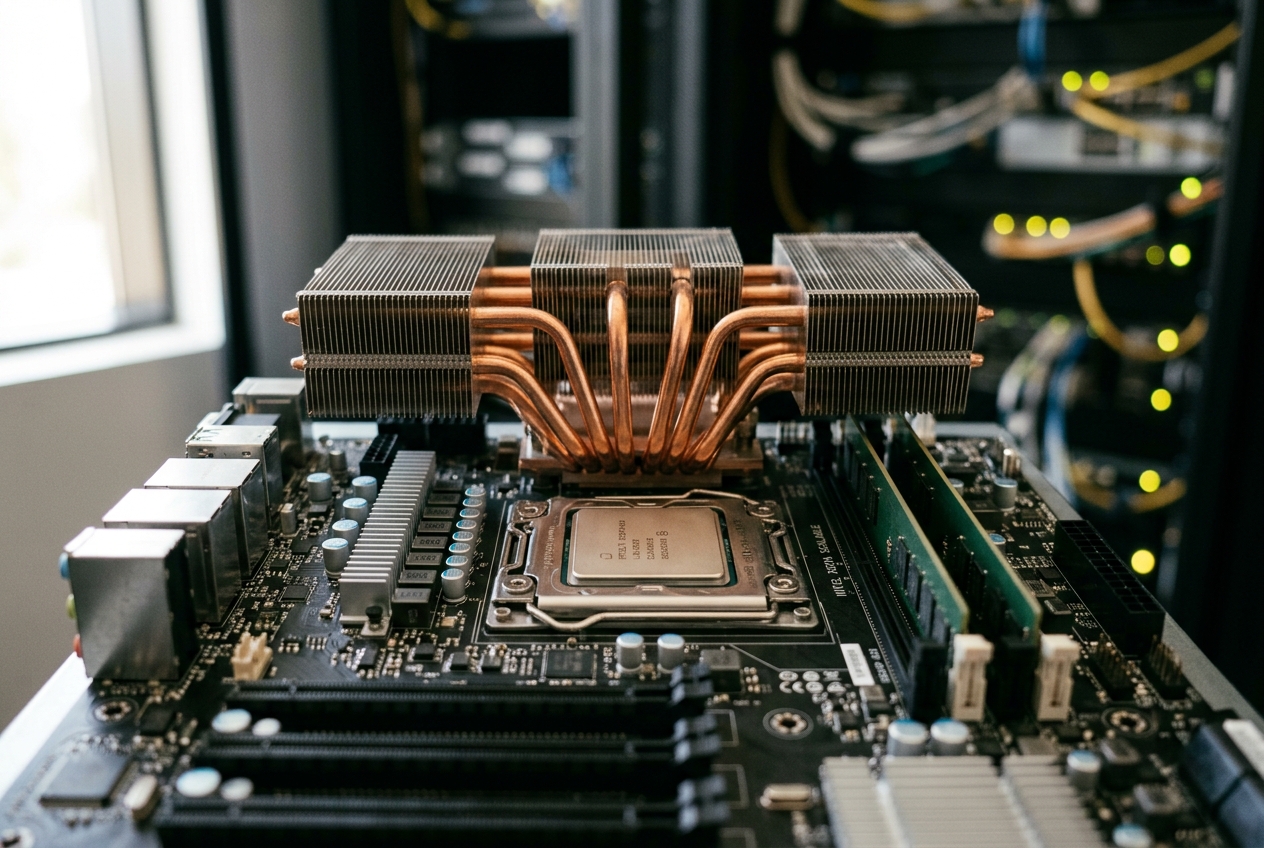
This baffling disconnect is every systems administrator’s nightmare: an invisible performance collapse where conventional diagnostic tools offer false reassurance. Standard Linux monitoring utilities like top, htop, and vmstat only measure the operating system's software abstractions. They tell you how much time the kernel scheduler spent attempting to assign work to execution threads, assuming the processor executes instructions at a predictable, steady pace. But modern computer silicon is not a static engine. It is an autonomous, hyper-reactive physical system governed by internal microcontrollers that throttle frequencies, cycle power gates, and plunge execution units into deep microsecond sleep states without ever consulting the Linux kernel.
When the operating system is blind to what the physical processor is actually doing, you need a tool that bypasses software assumptions entirely: turbostat. Engineered and maintained directly by Linux kernel developers, turbostat is a low-overhead diagnostic scalpel that interrogates the CPU hardware registers directly. It reads physical voltage rails, on-die digital thermal sensors, hardware performance counters, and power consumption meters in real time, revealing the hidden electrical and thermal drama unfolding on the silicon.
To immediately see what your physical hardware is doing beneath the software layer, run this single summary command:
sudo turbostat --Summary --interval 1 --num_iterations 1
turbostat version 2024.04.08 - calibrate TSC with /dev/cpu_dma_latency
CPUs    Core    Thread  Avg_MHz Busy%   Bzy_MHz TSC_MHz SMI CPU%c1  CPU%c6  CPU%c7  Pkg%pc2 Pkg%pc6 PkgWatt RAMWatt CoreTmp PkgTmp
128 64  128 120 3.32    3612    2994    0   12.40   84.28   0.00    15.20   72.11   184.21  38.15   42  46
In one concise line of telemetry, turbostat reveals four critical truths about your server:
- Busy% vs Avg_MHz: The actual percentage of time physical silicon executed instructions (3.32%) rather than waiting in an idle state.
- Bzy_MHz vs TSC_MHz: When the cores were active, they accelerated to 3,612 MHz (Bzy_MHz), comfortably above the baseline 2,994 MHz design clock (TSC_MHz). If Bzy_MHz drops far below TSC_MHz under heavy load, your server is throttling.
- Pkg%pc6 (72.11%): The physical CPU package spent nearly three-quarters of the sampling second in a deep, low-power sleep state (pc6).
- PkgWatt (184.21 W) / RAMWatt (38.15 W): The exact real-time energy consumed by the processor socket and memory subsystem.
Architectural Quick Start: How Turbostat Interrogates Silicon
Modern x86 processors from Intel and AMD contain internal telemetry and control registers known as Model-Specific Registers (MSRs). These registers are accessed through privileged assembly instructions (RDMSR and WRMSR). The Linux kernel exposes these registers to user space through character device nodes at /dev/cpu/*/msr via the Linux kernel MSR subsystem.
By reading specific registers—including IA32_APERF (Actual Performance Frequency Clock Count), IA32_MPERF (Maximum Performance Frequency Clock Count), the Time Stamp Counter (TSC), and Running Average Power Limit (RAPL) energy meters—turbostat calculates true microarchitectural metrics without distorting workloads through heavy profiling overhead.
- Samples RAPL Joules & Watts
- Calculates APERF / MPERF ratios
- Tracks SMI events & thermal deltas"] end subgraph KernelSpace["Kernel Space"] MSR["msr.ko Driver
(/dev/cpu/*/msr)"] end subgraph Hardware["Hardware / Silicon"] MSR_REGS["Model-Specific Registers (MSRs)
- 0xE8 (IA32_APERF) / 0xE7 (IA32_MPERF)
- 0x10 (Time Stamp Counter) / 0x34 (SMI Count)
- 0x611 (Package Energy) / 0x19C (Thermal Status)"] HW_UNITS["Autonomous Hardware Units
- Power Control Unit (PCU)
- Hardware-Controlled P-States (HWP)
- C-State Power Management"] end TS -->|"pread() / ioctl()"| MSR MSR -->|"RDMSR / WRMSR instructions"| MSR_REGS MSR_REGS --- HW_UNITS
Essential Command-Line Flags
| Flag | Argument / Syntax | Purpose |
|---|---|---|
-i, --interval |
<seconds> |
Defines the sampling interval in seconds (supports decimals such as 0.5). |
-s, --show |
<col1,col2,...> |
Limits terminal output strictly to specified columns. |
-H, --hide |
<col1,col2,...> |
Suppresses specific metric columns to unclutter the view. |
-S, --Summary |
(None) | Aggregates per-core and per-thread metrics into a single socket-wide summary row. |
-n, --num_iterations |
<integer> |
Halts data collection after a set number of interval samples. |
-J, --Joules |
(None) | Reports cumulative energy in Joules instead of average Watts. |
-a, --add |
<msr_spec> |
Monitors custom Model-Specific Registers specified by raw hex address. |
-c, --cpu |
<cpu-set> |
Limits interrogation to specific logical threads (e.g., 0-3,8). |
For full parameter definitions and extended capabilities, refer to the official turbostat(8) Linux manual page.
Five Real-World Production Triage Scenarios
1. Diagnosing Silent Thermal Throttling in High-Density Kubernetes Nodes
The Operational Scenario
A Kubernetes worker node running dense microservices begins missing execution deadlines. Prometheus dashboards show that CPU utilization across all containers has hit 100%, but actual request throughput has collapsed by 60%. The node has not panicked, and cgroup throttling counters (cpu.stat nr_throttled) read zero because Kubernetes CPU quotas have not been exceeded. The slowdown is happening entirely outside the kernel's view.
Diagnostic Command Execution
sudo turbostat --show Package,Core,CPU,Bzy_MHz,TSC_MHz,CoreTmp,PkgTmp,Busy%,PkgWatt --interval 2
Real Terminal Output
Package Core    CPU Busy%   Bzy_MHz TSC_MHz CoreTmp PkgTmp  PkgWatt
-   -   -   99.85   1197    3000    99  100 148.80
0   0   0   100.00  1200    3000    99  100 148.80
0   0   64  99.70   1195    3000    99  -   -
0   1   1   100.00  1200    3000    98  -   -
0   1   65  99.80   1198    3000    98  -   -
0   2   2   100.00  1194    3000    100 -   -
0   2   66  99.90   1196    3000    100 -   -
0   3   3   100.00  1200    3000    97  -   -
0   3   67  99.70   1197    3000    97  -   -
Line-by-Line Telemetry Analysis
TSC_MHzvsBzy_MHzDivergence: The Time Stamp Counter (TSC_MHz) shows a fixed baseline clock of 3,000 MHz (3.0 GHz). However, the actual unhalted clock frequency (Bzy_MHz) across all active cores has dropped to approximately 1,200 MHz.- Frequency Derivation:
turbostatcalculates real operational frequency using hardware counters: $$\text{Bzy_MHz} = \text{TSC_MHz} \times \frac{\Delta \text{APERF}}{\Delta \text{MPERF}}$$ Because the ratio of Actual Performance (APERF) to Reference Performance (MPERF) has plummeted to 0.40, the hardware is executing cycles at only 40% of its base capability. - Thermal Sensor Telemetry (
CoreTmp/PkgTmp): Core temperatures read between 97°C and 100°C, with the package hitting 100°C. The silicon has reached its Maximum Junction Temperature ($T_{j\text{Max}}$). - Autonomous Protection: The processor's embedded Power Control Unit (PCU) has engaged thermal throttling via the
IA32_THERM_STATUSregister. The Linux scheduler continues scheduling tasks at 100% capacity (Busy%$\approx 100\%$), but each instruction takes two and a half times longer to complete because the hardware is actively defending itself from physical heat damage.
Remediation and Next Steps
- Drain and Cordon the Node: Evacuate workloads immediately:
bash kubectl drain <node-name> --delete-emptydir-data --ignore-daemonsets - Inspect Kernel Thermal Logs: Correlate hardware throttling with kernel machine-check records:
bash sudo dmesg -T | grep -E -i "thermal|throttled|temperature" - Inspect Physical Server Infrastructure: Check for failed chassis fans, displaced airflow baffles, dried thermal interface paste between the heatsink and processor, or clogged server intake filters.
2. Pinpointing Tail Latency Jitter Caused by Deep Package Sleep States
The Operational Scenario
A bare-metal financial trading application experiences random 80-microsecond tail latency spikes whenever order activity resumes after brief pauses. Packet captures confirm the network is healthy and that delays originate entirely on the host. The infrastructure team has already set the CPU scaling governor to performance, assuming this prevents power-saving delays.
Diagnostic Command Execution
sudo turbostat --show CPU,Core,Bzy_MHz,Busy%,CPU%c1,CPU%c6,Pkg%pc2,Pkg%pc6,POW%pc6 --interval 1
Real Terminal Output
CPU Core    Busy%   Bzy_MHz CPU%c1  CPU%c6  Pkg%pc2 Pkg%pc6 POW%pc6
-   -   1.24    4498    2.15    96.61   0.00    94.32   94.30
0   0   1.85    4500    1.40    96.75   0.00    94.32   94.30
1   1   0.40    4492    3.10    96.50   0.00    94.32   94.30
2   2   0.12    4480    1.88    98.00   0.00    94.32   94.30
3   3   2.60    4512    2.20    95.20   0.00    94.32   94.30
Line-by-Line Telemetry Analysis
Bzy_MHz(4498–4512 MHz): Confirms that when cores are awake, theperformancegovernor successfully holds them at maximum turbo boost speeds.CPU%c6(95.20%–98.00%): Reveals that individual cores spend over 95% of their time in the deep C6 sleep state, where execution pipelines are halted, clocks are gated, and L1/L2 caches are flushed.Pkg%pc6(94.32%): Because all individual cores entered C6, the physical CPU socket autonomously entered Package C6 (pc6). In Package C6, uncore clock networks stop, the shared L3 cache is powered down to retention voltage, and the main memory bus enters self-refresh.- The Latency Penalty: Waking an entire CPU package from
pc6back toC0incurs an unskippable 80 to 120 microsecond physical hardware delay while voltages ramp and clock phase-locked loops (PLLs) re-lock. Incoming high-speed packets cannot be processed immediately upon arrival, creating the severe tail latency spikes observed by the application.
Uncore clocks stopped, L3 cache powered down NIC->>Pkg: High-priority network packet arrives Note over Pkg: Latency Trap: 80-120 µs physical delay Pkg->>Pkg: Restore uncore voltages & re-lock PLLs Pkg->>Pkg: Power up shared L3 cache & wake memory bus Pkg->>CPU: Transition core pipeline to active C0 state CPU->>App: Deliver packet (Latency SLA violated)
Remediation and Next Steps
- Clamp Hardware Sleep States via PM-QoS: Force the kernel and hardware to avoid deep sleep states using the Linux PM QoS interface:
bash # Set DMA latency tolerance to 0 microseconds via background file descriptor exec 3> /dev/cpu_dma_latency echo -ne "\x00\x00\x00\x00" >&3 - Disable Deep C-States in GRUB: Ensure low latency persists across reboots by editing
/etc/default/grub:bash GRUB_CMDLINE_LINUX_DEFAULT="intel_idle.max_cstate=1 processor.max_cstate=1 idle=poll" sudo update-grub - Verify with Turbostat: Run
turbostatagain to confirm thatPkg%pc6drops to and stays at0.00%.
3. Auditing Firmware Stalls and System Management Interrupts (SMIs)
The Operational Scenario
A real-time media streaming node experiences dropped frames and audio buffer underruns at predictable 60-second intervals. Advanced kernel profiling tools (perf, ftrace, and eBPF) show no kernel locking contention, no high-priority interrupts, and no runaway user processes. The operating system simply loses control of the hardware during the glitches.
Diagnostic Command Execution
sudo turbostat --show Package,Core,CPU,Bzy_MHz,Busy%,SMI,TSC_MHz --interval 1
Real Terminal Output
Package Core    CPU Busy%   Bzy_MHz TSC_MHz SMI
-   -   -   0.85    3200    3200    48
0   0   0   0.90    3200    3200    12
0   1   1   0.80    3200    3200    12
0   2   2   0.85    3200    3200    12
0   3   3   0.85    3200    3200    12
(One second later)
Package Core    CPU Busy%   Bzy_MHz TSC_MHz SMI
-   -   -   14.20   3200    3200    1420
0   0   0   14.50   3200    3200    355
0   1   1   14.10   3200    3200    355
0   2   2   14.00   3200    3200    355
0   3   3   14.20   3200    3200    355
Line-by-Line Telemetry Analysis
- The
SMICounter: Reads hardware registerMSR_SMI_COUNT(0x34), which increments whenever a System Management Interrupt is triggered. - Microarchitectural Preemption: In normal operation, SMIs remain near baseline levels. In the second sample, the counter explodes to 1,420 SMI events in a single second.
- System Management Mode (SMM): When an SMI fires, the processor halts the Linux kernel, switches execution into ring -2 (System Management Mode), and executes proprietary motherboard BIOS firmware stored in isolated SMRAM.
- The Firmware Blackout: While running in SMM, the Linux kernel is entirely frozen. Interrupt handling is suspended and profiling counters cannot increment. The 1,420 SMIs caused cumulative pauses totaling hundreds of milliseconds, dropping audio packets without generating a single kernel log error.
Remediation and Next Steps
- Measure Firmware Interruption Latency: Verify the freeze duration using the kernel's hardware latency tracer:
bash sudo cat /sys/kernel/debug/tracing/available_tracers | grep hwlat echo hwlat | sudo tee /sys/kernel/debug/tracing/current_tracer sudo cat /sys/kernel/debug/tracing/trace - Reconfigure BIOS/UEFI Settings: - Disable Legacy USB Emulation (a frequent source of background polling SMIs). - Transfer chassis fan and thermal management from BIOS control to the Baseboard Management Controller (BMC/IPMI). - Disable Memory Error Injection (EINJ) routines. - Disable BIOS-managed PCIe Active State Power Management (ASPM).
- Flash System Firmware: Apply the latest motherboard UEFI and BMC firmware releases provided by the server vendor.
4. Profiling Multi-Socket NUMA Power Dissipation and RAPL Bottlenecks
The Operational Scenario
An enterprise database running on a dual-socket server exhibits erratic query completion times. The database administrator suspects cross-socket memory bus saturation or socket-level power capping under mixed read-write loads.
Diagnostic Command Execution
sudo turbostat --show Package,Node,Core,CPU,Bzy_MHz,Busy%,PkgWatt,CorWatt,UncWatt,RAMWatt,PKG_% --interval 5
Real Terminal Output
Package Node    Core    CPU Busy%   Bzy_MHz PkgWatt CorWatt UncWatt RAMWatt PKG_%
-   -   -   -   48.50   3100    342.15  210.40  42.10   89.65   0.00
0   0   0   0   92.40   3400    225.05  155.20  24.15   45.70   0.00
0   0   1   1   91.80   3395    -   -   -   -   -
1   1   0   2   4.60    1800    117.10  55.20   17.95   43.95   0.00
1   1   1   3   5.20    1805    -   -   -   -   -
Line-by-Line Telemetry Analysis
- Power Domain Decomposition:
turbostatbreaks down power draw across the Intel/AMD RAPL architecture: -PkgWatt(342.15 W total): Combined power consumed by both physical processor sockets. -CorWatt(210.40 W total): Power consumed strictly by the computing execution cores. -UncWatt(42.10 W total): Power consumed by uncore components (integrated memory controllers, interconnects, and shared L3 cache slices). -RAMWatt(89.65 W total): Power consumed by attached DDR DIMM channels. - Cross-Socket Imbalance:
- Socket 0 (Package 0): Operating at 92.40% core utilization (
Busy%) and running at 3.4 GHz (Bzy_MHz), drawing 225.05 Watts. - Socket 1 (Package 1): Operating at only 4.60% utilization, locked at base frequency (1.8 GHz), drawing 117.10 Watts. - The Bottleneck: Socket 0 is approaching its physical thermal and electrical limits. Heavy memory activity on Socket 0 (
RAMWatt= 45.70 W) alongside uncore cross-talk indicates that worker threads on Socket 0 are constantly accessing memory on Socket 1, congesting the interconnect bus and degrading query response times.
Remediation and Next Steps
- Inspect Process NUMA Affinity: Check whether memory allocations are evenly balanced across nodes:
bash numastat -c <database_process_name> - Bind Worker Threads and Memory Domains: Use
numactlto pin database instances and interleave memory access:bash numactl --cpunodebind=0,1 --interleave=0,1 /usr/bin/db_engine --config /etc/db.conf - Verify Power Distribution: Use
turbostatto ensurePkgWattandBusy%distribute symmetrically across both sockets.
5. Verifying Autonomous Frequency Scaling and Energy-Performance Preferences (EPP)
The Operational Scenario
Following a kernel upgrade across a compute cluster, single-threaded batch processing jobs run 30% slower. The team needs to verify whether Hardware-Controlled P-States (HWP / Intel Speed Shift) are operating correctly and whether the Energy-Performance Preference (EPP) register is misconfigured.
Diagnostic Command Execution
sudo turbostat --show Package,Core,CPU,Bzy_MHz,TSC_MHz,EPP,HWP_Cur,HWP_Min,HWP_Req,Busy% --interval 1
Real Terminal Output
Package Core    CPU Busy%   Bzy_MHz TSC_MHz EPP HWP_Cur HWP_Min HWP_Req
-   -   -   100.0   2000    3000    128 20  8   20
0   0   0   100.0   2000    3000    128 20  8   20
0   1   1   100.0   2000    3000    128 20  8   20
0   2   2   100.0   2000    3000    128 20  8   20
0   3   3   100.0   2000    3000    128 20  8   20
Line-by-Line Telemetry Analysis
EPP(Energy-Performance Preference): Reads the energy bias field in theIA32_HWP_REQUESTregister (0x774). The value 128 corresponds tobalance_power(where 0 = maximum performance, 128 = balanced power, and 255 = maximum energy savings).HWP_Req(Requested Multiplier): The operating system has requested a modest performance multiplier of 20.- Frequency Capping: Even though the workload is fully utilizing the CPU (
Busy%= 100.0%),Bzy_MHzis clamped at 2,000 MHz (well below the 3,000 MHz base clock). The processor's autonomous power controller is refusing to engage turbo boost because the energy preference is biased toward power conservation.
Remediation and Next Steps
- Set EPP to Maximum Performance: Update the sysfs interface across all logical cores:
bash for cpu in /sys/devices/system/cpu/cpu*/cpufreq/energy_performance_preference; do echo "performance" | sudo tee "$cpu" done - Set the Performance Governor: Ensure the scaling governor requests maximum throughput:
bash sudo cpupower frequency-set -g performance - Verify with Turbostat: Confirm that
EPPreads 0,HWP_Reqjumps to maximum multiplier, andBzy_MHzimmediately ramps up to peak turbo speeds.
What Can Go Wrong: Pitfalls and Hypervisor Gaps
1. Missing Kernel Modules and Lockdown Restrictions
turbostat requires raw access to Model-Specific Registers via /dev/cpu/*/msr.
turbostat: /dev/cpu/0/msr open failed: No such file or directory
turbostat: msr module not loaded?
- Solution: Load the driver directly:
bash sudo modprobe msr - Kernel Lockdown Hazard: If UEFI Secure Boot is active, Linux may enforce kernel lockdown mode (
integrityorconfidentiality), preventing evenrootfrom accessing raw hardware registers:bash cat /sys/kernel/security/lockdownIf lockdown is active, raw MSR queries are blocked by kernel security policy to prevent arbitrary ring-0 modifications.
2. Virtual Machine Masking and Cloud Blindspots
Running turbostat inside standard cloud virtual machines (such as AWS EC2 or GCP Compute Engine instances) often returns incomplete or zeroed data:
Package Core    CPU Busy%   Bzy_MHz TSC_MHz PkgWatt
-   -   -   12.4    0   2400    0.00
- Root Cause: Hypervisors trap and mask
RDMSRinstructions to prevent cross-tenant information leaks and side-channel vulnerabilities. - Solution: Run
turbostaton bare-metal hardware, within the hypervisor base host (e.g., KVM host), or on dedicated bare-metal cloud instances (such as AWS.metalinstances).
3. Sampling Overhead on Large Multi-Socket Servers
Running turbostat with extremely aggressive intervals (such as -i 0.001 for 1 millisecond) across servers with 256 or more cores can trigger kernel contention on the MSR driver mutex.
- Mitigation: Maintain sampling intervals at or above 1.0 second in production, or restrict sampling to specific cores using the
-cflag.
Architectural Comparison: Linux Performance Utilities
| Diagnostic Layer | Utility | Primary Telemetry Source | Overhead | Strengths | Limitations |
|---|---|---|---|---|---|
| Microarchitectural & Power | turbostat |
Direct MSRs, RAPL, DTS Sensors (/dev/cpu/*/msr) |
Ultra-Low | Real operating frequencies, C-state sleep residency, SMI counts, package/DRAM power in Watts. | Requires root/MSR access; masked inside virtual machines. |
| Scheduler & Process Queue | top / htop |
Virtual filesystems (/proc/stat, /proc/[pid]/stat) |
Low to Medium | Process-level tracking, user vs kernel time, thread states. | Blind to true hardware clock speeds, thermal throttling, and deep sleep states. |
| Hardware Counter Profiling | perf |
Performance Monitoring Units (perf_event_open) |
Low to High | Instruction-level profiling, cache misses (L1/L2/LLC), branch mispredictions, flame graphs. | Complex setup; does not track package-level power dissipation or SMIs out of the box. |
| Hardware Sensors & Fans | sensors |
sysfs hwmon interfaces (/sys/class/hwmon) |
Very Low | Motherboard rail voltages, fan RPMs, ambient chassis temperatures. | Point-in-time reads; lacks frequency correlation and C-state telemetry. |
Integrating Turbostat into Automated SRE Telemetry Pipelines
To monitor low-level hardware health continuously across server fleets, SREs can export turbostat metrics directly into Prometheus or OpenTelemetry collector pipelines.
The following bash script samples system-wide hardware telemetry and exports it to the Prometheus node-exporter textfile collector:
#!/usr/bin/env bash
# turbostat-prometheus-exporter.sh: Export hardware telemetry to Prometheus node-exporter
set -euo pipefail

METRIC_FILE="/var/lib/node_exporter/textfile_collector/turbostat.prom"
TMP_FILE="${METRIC_FILE}.tmp"

# Sample system-wide hardware telemetry over a 2-second sampling window
sudo turbostat --Summary --interval 2 --num_iterations 1 \
  --show Busy%,Bzy_MHz,TSC_MHz,SMI,Pkg%pc6,PkgWatt,RAMWatt,PkgTmp \
  2>/dev/null | tail -n 1 | awk '
{
  print "# HELP node_cpu_busy_percent Hardware busy percentage across all cores"
  print "# TYPE node_cpu_busy_percent gauge"
  print "node_cpu_busy_percent " $1

  print "# HELP node_cpu_actual_frequency_mhz Actual hardware operating frequency in MHz"
  print "# TYPE node_cpu_actual_frequency_mhz gauge"
  print "node_cpu_actual_frequency_mhz " $2

  print "# HELP node_cpu_tsc_frequency_mhz Base Time Stamp Counter frequency in MHz"
  print "# TYPE node_cpu_tsc_frequency_mhz gauge"
  print "node_cpu_tsc_frequency_mhz " $3

  print "# HELP node_smi_interrupts_total System Management Interrupt count during interval"
  print "# TYPE node_smi_interrupts_total counter"
  print "node_smi_interrupts_total " $4

  print "# HELP node_cpu_package_c6_residency_percent Package C6 sleep state residency percentage"
  print "# TYPE node_cpu_package_c6_residency_percent gauge"
  print "node_cpu_package_c6_residency_percent " $5

  print "# HELP node_cpu_package_power_watts Socket power consumption in Watts"
  print "# TYPE node_cpu_package_power_watts gauge"
  print "node_cpu_package_power_watts " $6

  print "# HELP node_dram_power_watts Memory controller power consumption in Watts"
  print "# TYPE node_dram_power_watts gauge"
  print "node_dram_power_watts " $7

  print "# HELP node_cpu_package_temperature_celsius Package temperature in Celsius"
  print "# TYPE node_cpu_package_temperature_celsius gauge"
  print "node_cpu_package_temperature_celsius " $8
}' > "$TMP_FILE"

mv "$TMP_FILE" "$METRIC_FILE"
Today's Takeaway
The operating system scheduler's view of your computing hardware is a convenient abstraction that does not always reflect physical silicon reality. When tracking down erratic tail latency, sudden throughput drops, or mysterious server pauses, relying solely on /proc/stat tools like top leaves you blind to critical hardware-level dynamics. Take five minutes right now to log into one of your bare-metal Linux servers and run sudo turbostat --Summary --interval 1 --num_iterations 5. Compare your actual operating frequency (Bzy_MHz) against your base clock (TSC_MHz) to ensure your CPU is not silently throttling, inspect your Pkg%pc6 percentage to verify that deep package sleep states are not inflating your latency budgets, and check the SMI counter to ensure firmware routines are not quietly stealing compute cycles behind your operating system's back.