Cpupower: Tuning Dynamic Frequency Scaling Governors, Managing Energy Performance Biases, and Enforcing Low-Latency Processor Baselines in Production
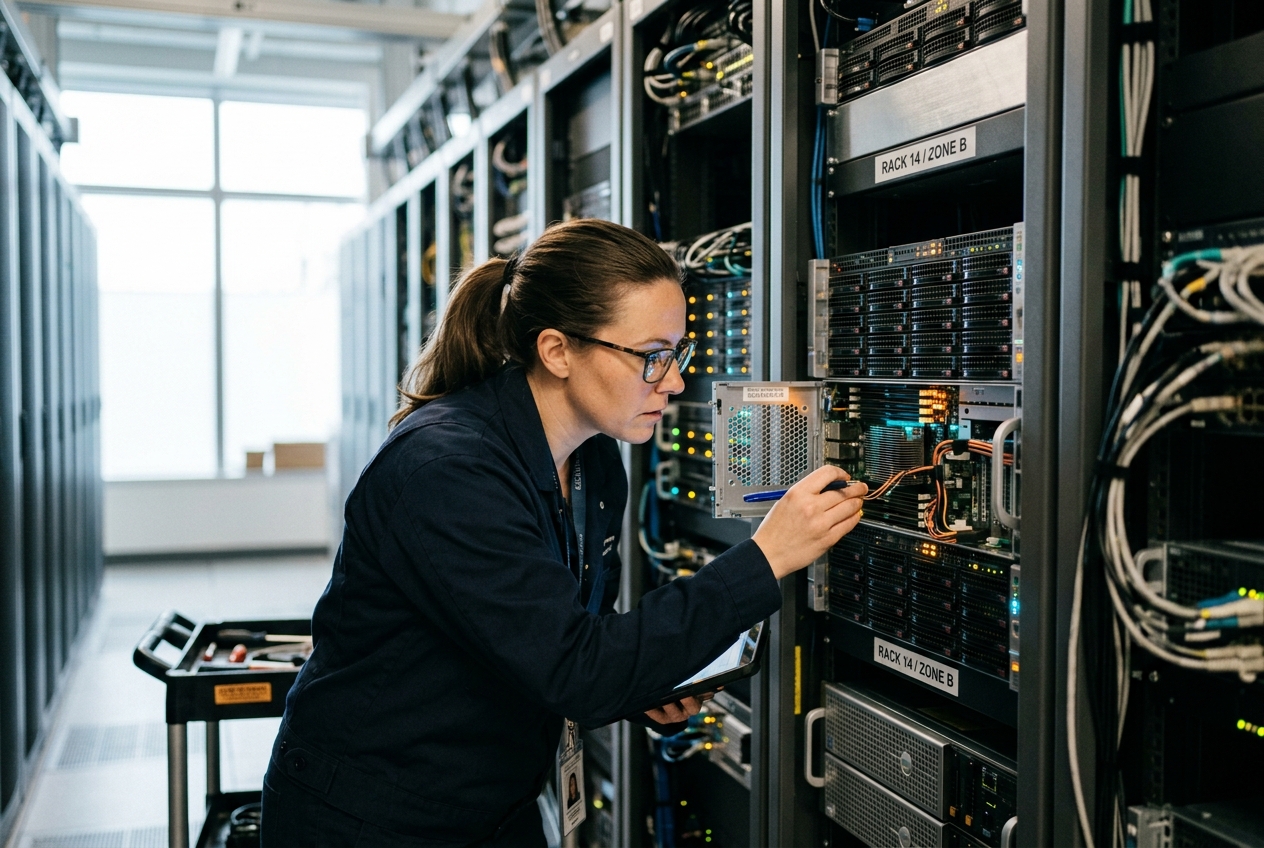
The culprit is an invisible design feature of modern computing: energy conservation. Today's multicore processors are engineered to be aggressively frugal with power. The moment computational demand dips for even a fraction of a millisecond, the operating system drops the silicon into a low-power slumber, slashing clock speeds from several gigahertz down to a crawl. When a burst of database queries suddenly arrives, the processor must wake up, synchronise its internal clock circuits, and step up its voltage before it can execute work at full speed. For bursty, high-throughput workloads, this constant cycle of dozing off and waking up introduces erratic, multi-millisecond lag spikes.
The master key for diagnosing and controlling this behaviour in Linux is cpupower. Instead of forcing system administrators to decipher and manually edit obscure kernel variables scattered across the /sys filesystem, cpupower provides a clean, unified command-line interface to inspect hardware limits, switch frequency profiles, and demand predictable, low-latency performance from your silicon.
If you are investigating uncharacteristic system lag or simply want to check how your server is managing its power right now, the single most illuminating command you can run is sudo cpupower frequency-info:
$ sudo cpupower frequency-info
analyzing CPU 0:
  driver: intel_pstate
  CPUs which run at the same hardware frequency: 0
  CPUs which need to have their frequency coordinated by software: 0
  maximum transition latency:  Cannot determine or is not supported.
  hardware limits: 800 MHz - 3.80 GHz
  available cpufreq governors: performance powersave
  current policy: frequency should be within 800 MHz and 3.80 GHz.
                  The governor "powersave" may decide which speed to use
                  within this range.
  current CPU frequency: 1.24 GHz (asserted by call to hardware)
  boost state support:
    Supported: yes
    Active: yes
In a dozen lines, this diagnostic snapshot tells you the fundamental rules governing your processor: the active kernel driver (intel_pstate), the absolute physical clock boundaries (800 MHz to 3.80 GHz), the operational policy governing clock adjustments (powersave), the real-time speed of the core (1.24 GHz), and whether thermal Turbo Boost is available and active.
The Core Subcommands at a Glance
The cpupower toolkit is organised into modular subcommands tailored for inspection, live adjustment, and hardware monitoring:
| Command | Primary Function | Typical Use Case |
|---|---|---|
cpupower frequency-info |
Queries active scaling drivers, available governors, and frequency limits. | Baseline auditing and hardware capability checks. |
cpupower frequency-set |
Modifies active governors, frequency floors, and ceilings. | Locking clock speeds for databases or capping heat on dense nodes. |
cpupower set |
Configures low-level Energy Performance Bias and Preference registers. | Fine-tuning hardware registers for ultra-low latency trading or HPC. |
cpupower monitor |
Captures real-time core frequency counters and idle sleep residencies. | Diagnosing thread stalls and validating actual core workloads. |
cpupower idle-info |
Inspects deep C-state sleep tiers and transition latencies. | Identifying wake-up penalties caused by deep idle sleep modes. |
To target specific processor cores rather than the entire system, append the -c or --cpu flag followed by a comma-separated list or numeric range (for example, sudo cpupower -c 0-15 frequency-set -g performance).
How Linux Governs Processor Speed
To understand why a server behaves the way it does, it helps to understand how instructions flow from userspace tools down to the actual silicon:
(frequency-set / set / monitor)"] end subgraph Kernel ["Linux Kernel Core"] Sysfs["Sysfs Abstraction Layer
(/sys/devices/system/cpu/cpu*/cpufreq/)"] Drivers["CPUFreq Drivers
(intel_pstate / amd-pstate / acpi-cpufreq)"] Governors["Scaling Policies & Governors
(performance / powersave / schedutil)"] end subgraph Silicon ["Processor Hardware"] Hardware["On-Die Energy Registers & Coprocessors
(IA32_HWP_REQUEST / APERF & MPERF / ACPI CPPC v2)"] end CLI --> Sysfs Sysfs --> Drivers Drivers --> Governors Governors --> Hardware
Modern architectures from Intel and AMD rely on autonomous hardware management known as Collaborative Processor Performance Control (CPPC) or Hardware P-States (HWP). While legacy systems relied entirely on operating system software governors to calculate and set frequencies step by step, modern processors make frequency decisions in microseconds on the silicon itself, guided by the high-level policy policies and energy biases set through cpupower. For deeper technical explorations of these kernel interfaces, consult the Intel P-State Documentation and AMD P-State Driver Documentation.
Five Real-World Production Use Cases
1. Auditing Multi-Core Topologies and Driver Consistency
The Scenario
You are commissioning a dual-socket, 128-core bare-metal server for a multi-tenant virtualisation cluster. Applications scheduled on the second processor socket (NUMA node 1) run noticeably slower and experience irregular execution timing compared to those on the first socket. You need to inspect both sockets simultaneously to determine whether they are running identical kernel drivers, operating policies, and hardware boost settings.
The Command
$ sudo cpupower -c 0,64 frequency-info
Realistic Terminal Output
analyzing CPU 0:
  driver: amd-pstate-epp
  CPUs which run at the same hardware frequency: 0
  CPUs which need to have their frequency coordinated by software: 0
  maximum transition latency:  Cannot determine or is not supported.
  hardware limits: 400 MHz - 3.70 GHz
  available cpufreq governors: performance powersave
  current policy: frequency should be within 400 MHz and 3.70 GHz.
                  The governor "powersave" may decide which speed to use
                  within this range.
  current CPU frequency: 2.45 GHz (asserted by call to hardware)
  boost state support:
    Supported: yes
    Active: yes
analyzing CPU 64:
  driver: acpi-cpufreq
  CPUs which run at the same hardware frequency: 64
  CPUs which need to have their frequency coordinated by software: 64
  maximum transition latency: 10.0 us
  hardware limits: 1.20 GHz - 3.00 GHz
  available cpufreq governors: conservative ondemand userspace powersave performance schedutil
  current policy: frequency should be within 1.20 GHz and 3.00 GHz.
                  The governor "schedutil" may decide which speed to use
                  within this range.
  current CPU frequency: 1.20 GHz (asserted by call to kernel code)
  boost state support:
    Supported: yes
    Active: no
Line-by-Line Breakdown
analyzing CPU 0vsanalyzing CPU 64: CPU 0 (Socket 0) is running the modernamd-pstate-eppdriver with autonomous hardware frequency scaling. CPU 64 (Socket 1) has fallen back to the legacyacpi-cpufreqdriver.maximum transition latency: 10.0 us: The legacy driver on Socket 1 incurs a 10-microsecond software penalty every time it adjusts frequency, whereas Socket 0 delegates transitions directly to fast hardware coprocessors.hardware limits: Socket 0 scales dynamically from 400 MHz up to 3.70 GHz; Socket 1 is restricted between 1.20 GHz and 3.00 GHz due to missing hardware coordination tables.boost state support: Active: yesvsActive: no: Dynamic Turbo Boost is actively accelerating Core 0, but is completely disabled on Core 64.
What the Administrator Does Next
Reboot the server into its UEFI/BIOS setup utility and verify that Collaborative Processor Performance Control (CPPC) and Core Performance Boost are enabled across all processor sockets. Next, add the kernel parameter amd_pstate=active to /etc/default/grub, run update-grub, and reboot to guarantee consistent driver initialization across all NUMA nodes.
2. Enforcing Deterministic High-Throughput Performance on Database Nodes
The Scenario
An enterprise PostgreSQL and Cassandra cluster suffers from severe 99.9th percentile latency degradation under bursty write traffic. During brief lulls in transactional activity, the scaling governor drops core frequencies to save power. When a heavy batch of commits arrives, the delay required for cores to ramp up clock speeds causes transaction timeouts. You need to lock all logical cores to their maximum operating frequency to eliminate frequency transition delays entirely.
The Command
$ sudo cpupower frequency-set -g performance
Realistic Terminal Output
Setting cpu: 0
Setting cpu: 1
Setting cpu: 2
Setting cpu: 3
...
Setting cpu: 95
To verify the enforcement across all logical cores:
$ sudo cpupower frequency-info -o
Active CPU frequency scaling governor: performance
All CPUs are operating under the "performance" scaling policy.
Frequency ceiling: 3.80 GHz | Frequency floor: 3.80 GHz
Driver: intel_pstate (Active Mode)
Line-by-Line Breakdown
Setting cpu: 0 ... 95: Iterates through every online execution thread registered in the system and writes theperformancepolicy to/sys/devices/system/cpu/cpu*/cpufreq/scaling_governor.Active CPU frequency scaling governor: performance: Confirms that the kernel driver has ceased downclocking execution units during quiet periods.Frequency ceiling: 3.80 GHz | Frequency floor: 3.80 GHz: Internal clock generators and voltage rails are pinned to their maximum operational frequency, ensuring immediate execution for incoming SQL queries.
What the Administrator Does Next
Run database query latency benchmarks to confirm that the tail latency spikes have vanished. To make this setting permanent across system reboots, configure /etc/default/cpupower with governor="performance" and enable the systemd service via sudo systemctl enable --now cpupower.service.
3. Calibrating Energy Performance Bias for Low-Latency Execution
The Scenario
In an algorithmic trading or real-time event-processing pipeline, setting the governor to performance alone is not enough. Modern x86 processors contain dedicated Energy-Performance Bias (EPB) and Energy Performance Preference (EPP) registers (IA32_ENERGY_PERF_BIAS / IA32_HWP_REQUEST). These internal registers instruct the on-die power coprocessor how aggressively to balance instruction execution speed against power dissipation and temperature. You must set these registers to raw performance (0), preventing the chip from delaying clock ramp-up or powering down internal interconnects during microsecond pauses.
The Command
$ sudo cpupower set --perf-bias 0
$ sudo cpupower set --epp performance
To confirm the new register values:
$ sudo cpupower info
Realistic Terminal Output
analyzing CPU 0:
  EPB: 0 (performance)
  EPP: performance [energy_perf_preference: performance]
analyzing CPU 1:
  EPB: 0 (performance)
  EPP: performance [energy_perf_preference: performance]
...
analyzing CPU 63:
  EPB: 0 (performance)
  EPP: performance [energy_perf_preference: performance]
Line-by-Line Breakdown
EPB: 0 (performance): Configures the hardware model-specific register to numeric value0across all cores. A value of0denotes maximum performance (default operating system profiles typically default to a balanced value of6or7).EPP: performance: Instructs the autonomous on-die power microcontroller to prioritize execution throughput and minimum transition latency over all power-saving targets.
What the Administrator Does Next
Run cache-to-cache latency benchmarks and network timestamping tests to measure execution consistency. Next, use cpupower idle-info to inspect idle sleep tiers and consider using cpupower idle-set to disable deep C-states (such as C6), which can introduce unwanted microsecond wake-up delays.
4. Imposing Frequency Bounds for Thermal and Power Caps
The Scenario
A high-density blade chassis hosting compute jobs is suffering from thermal throttling during peak ambient summer temperatures. When all cores enter maximum turbo boost simultaneously, total power consumption exceeds the rack's power delivery threshold, causing fans to spin at maximum speed and tripping chassis thermal alerts. You need to enforce strict lower and upper frequency boundaries across all CPUs to cap peak power consumption while keeping clock speeds above a predictable baseline.
The Command
$ sudo cpupower frequency-set -d 1.8GHz -u 2.6GHz -g schedutil
Realistic Terminal Output
Setting cpu: 0
Setting cpu: 1
...
Setting cpu: 127
To verify the constraints on the primary core:
$ sudo cpupower -c 0 frequency-info
analyzing CPU 0:
  driver: intel_pstate
  hardware limits: 800 MHz - 3.60 GHz
  available cpufreq governors: performance powersave schedutil
  current policy: frequency should be within 1.80 GHz and 2.60 GHz.
                  The governor "schedutil" may decide which speed to use
                  within this range.
  current CPU frequency: 2.21 GHz (asserted by call to hardware)
Line-by-Line Breakdown
-d 1.8GHz: Enforces a scaling floor (scaling_min_freq) of 1.80 GHz, preventing cores from dropping to an inefficient 800 MHz idle floor during execution.-u 2.6GHz: Establishes a hard frequency ceiling (scaling_max_freq) of 2.60 GHz, trimming off the top 1.0 GHz of thermal turbo boost that accounts for the highest power draw.-g schedutil: Selects the kernel scheduler governor, which calculates frequency scaling directly from task load metrics.current policy: frequency should be within 1.80 GHz and 2.60 GHz: The kernel CPUFreq core now constrains all scaling decisions strictly inside this predictable window.
What the Administrator Does Next
Monitor out-of-band chassis power telemetry using IPMI sensors or Prometheus metrics to verify that total blade power consumption remains safely within designated rack power limits under maximum multi-threaded workloads.
5. Auditing Real-Time Multi-Core Clock and C-State Distribution
The Scenario
During a load test on a distributed Kafka cluster, monitoring dashboards indicate 90% overall CPU utilisation, but message throughput is falling significantly short of expected capacity. You need to capture low-level hardware performance counters to see whether cores are actively crunching instructions or spending unexpected amounts of time stalled in deep sleep states.
The Command
$ sudo cpupower monitor -m Mperf,Idle_Stats -i 2
Realistic Terminal Output
| Mperf               || Idle_Stats
CPU | C0   | Cx   | Freq || POLL | C1   | C2   | C6
0   | 88.4 | 11.6 | 3214 || 0.0  | 2.1  | 1.5  | 8.0
1   | 45.2 | 54.8 | 2100 || 0.0  | 5.4  | 12.1 | 37.3
2   | 92.1 |  7.9 | 3405 || 0.0  | 0.8  | 1.1  | 6.0
3   | 12.0 | 88.0 | 1200 || 0.1  | 4.2  | 8.7  | 75.0
Line-by-Line Breakdown
-m Mperf,Idle_Stats: Directs the monitor module to query hardware Model-Specific Registers:MPERF(Maximum Performance Clock Count),APERF(Actual Performance Clock Count), and idle C-state counters.-i 2: Samples processor hardware registers continuously across a two-second interval.C0 | Cx | Freq:- Core 0 spent 88.4% of the time executing instructions in the active state (
C0) at an average clock rate of 3,214 MHz. - Core 3 spent only 12.0% of the sample in
C0, spending 88.0% of its time idling in sleep states (Cx) at a lowered frequency of 1,200 MHz. Idle_Stats (POLL, C1, C2, C6): Core 3 resided in the deep power-downC6state for 75.0% of the sample period. Waking fromC6requires re-energising core circuits and restoring cache state, introducing noticeable latency spikes whenever intermittent Kafka consumer events arrive.
What the Administrator Does Next
The stark disparity between Core 0 and Core 3 points to thread affinity and scheduling imbalances. Bind Kafka network worker threads directly to active cores using taskset or numactl, and disable the deep C6 sleep state on latency-sensitive cores using sudo cpupower idle-set -d 3.
What Can Go Wrong: Common Pitfalls and Recovery
Operating at the boundary between the Linux kernel and low-level processor power planes carries specific operational risks. Here are the three most frequent issues encountered in production:
1. The "Ghost Configuration": Driver Mismatches and Passive Semantics
A common mistake occurs when administrators attempt to apply legacy governor names (such as ondemand or conservative) to modern processors managed by autonomous drivers:
$ sudo cpupower frequency-set -g ondemand
Setting cpu: 0
Error: Governor "ondemand" not available
The Cause: In autonomous ("active") mode, the driver delegates P-state selection directly to on-die hardware logic. It exposes only performance and powersave targets to userspace. In this mode, powersave does not mean "lock to minimum frequency"—rather, it functions as an autonomous scaling policy that leverages hardware preferences.
| Driver Mode | Available Governors | Internal Scaling Mechanism |
|---|---|---|
intel_pstate (Active) / amd-pstate-epp |
performance, powersave |
Autonomous on-chip hardware registers (HWP / EPP) determine clock transitions. |
intel_pstate (Passive) / amd-pstate (Passive) |
performance, powersave, schedutil, ondemand, conservative |
Linux kernel CPUFreq framework calculates frequency targets in software. |
Recovery: Check available governors using cpupower frequency-info. If fine-grained software governor selection is required, switch the driver to passive mode by adding intel_pstate=passive or amd_pstate=passive to /etc/default/grub, followed by update-grub and a system reboot.
2. UEFI / BIOS Firmware Overrides
You may apply sudo cpupower frequency-set -g performance and set --perf-bias 0, yet observe your CPU frequencies stuck at baseline speeds under heavy load.
The Cause: Hardware-level platform firmware (UEFI/BIOS) settings override operating system requests. If the system BIOS has "Energy Efficient Turbo" enabled, OS-controlled P-states disabled, or static platform power caps enforced, the processor will ignore software scaling commands.
Recovery: Query the hardware boost state:
$ sudo cpupower frequency-info | grep -A2 "boost state"
If hardware boost is disabled at the firmware level, inspect the sysfs interface:
$ cat /sys/devices/system/cpu/cpufreq/boost
If it returns 0, attempt software re-enablement:
$ echo 1 | sudo tee /sys/devices/system/cpu/cpufreq/boost
If this write fails with an I/O error, the override is locked in system firmware and must be re-enabled via the machine's UEFI setup interface.
3. Settings Lost After Reboot
Running cpupower frequency-set or cpupower set modifies runtime kernel state held in volatile memory. These settings do not persist across system reboots.
Recovery: Configure the standard systemd service. On Debian, Ubuntu, RHEL, and Rocky Linux systems, update the global configuration file:
# /etc/default/cpupower or /etc/sysconfig/cpupower
governor='performance'
min_freq='1.8GHz'
max_freq='3.8GHz'
perf_bias='0'
Enable and start the service to apply these rules on every boot:
$ sudo systemctl enable --now cpupower.service
$ sudo systemctl status cpupower.service
Authoritative References & Further Reading
To explore Linux kernel power scaling and micro-architectural power management in greater technical depth, consult these primary documentation resources:
- Linux Kernel CPU Performance Scaling Documentation: The authoritative Linux kernel documentation covering the CPUFreq core subsystem, governor algorithms, and sysfs interfaces.
- ArchWiki CPU Frequency Scaling Architecture Guide: A comprehensive systems administration guide for configuring drivers, governors, and persistence daemons.
- Linux Kernel Intel P-State Driver Manual: Complete architectural documentation on HWP, active vs. passive modes, and Energy Performance Preference registers.
- Linux Kernel AMD P-State Driver Documentation: Deep-dive into AMD Collaborative Processor Performance Control (CPPC) architectures on modern Zen silicon.
- cpupower(1) Linux Man Page: The official Unix manual page detailing binary invocation syntax, subcommands, and target interfaces.
Today's Takeaway
A modern processor is not a static engine running at fixed clock speeds; it is a dynamic thermodynamic system constantly balancing power consumption, heat, and computational demand. Running high-throughput, latency-critical production workloads without actively managing CPU governors is an open invitation to unpredictable tail latencies.
Take five minutes right now: open a terminal on your primary server or workstation, run sudo cpupower frequency-info, and inspect your active scaling driver and governor profile. If your latency-critical database or hypervisor is running the default powersave governor with conservative energy-bias values, execute sudo cpupower frequency-set -g performance and sudo cpupower set --perf-bias 0. You will immediately eliminate frequency transition lag, lock your machine into deterministic execution, and unlock the true throughput your hardware was engineered to deliver.