Blktrace: Tracing Kernel Block Layer I/O Events, Diagnosing Device Queue Latencies, and Profiling Storage Subsystem Bottlenecks in Production
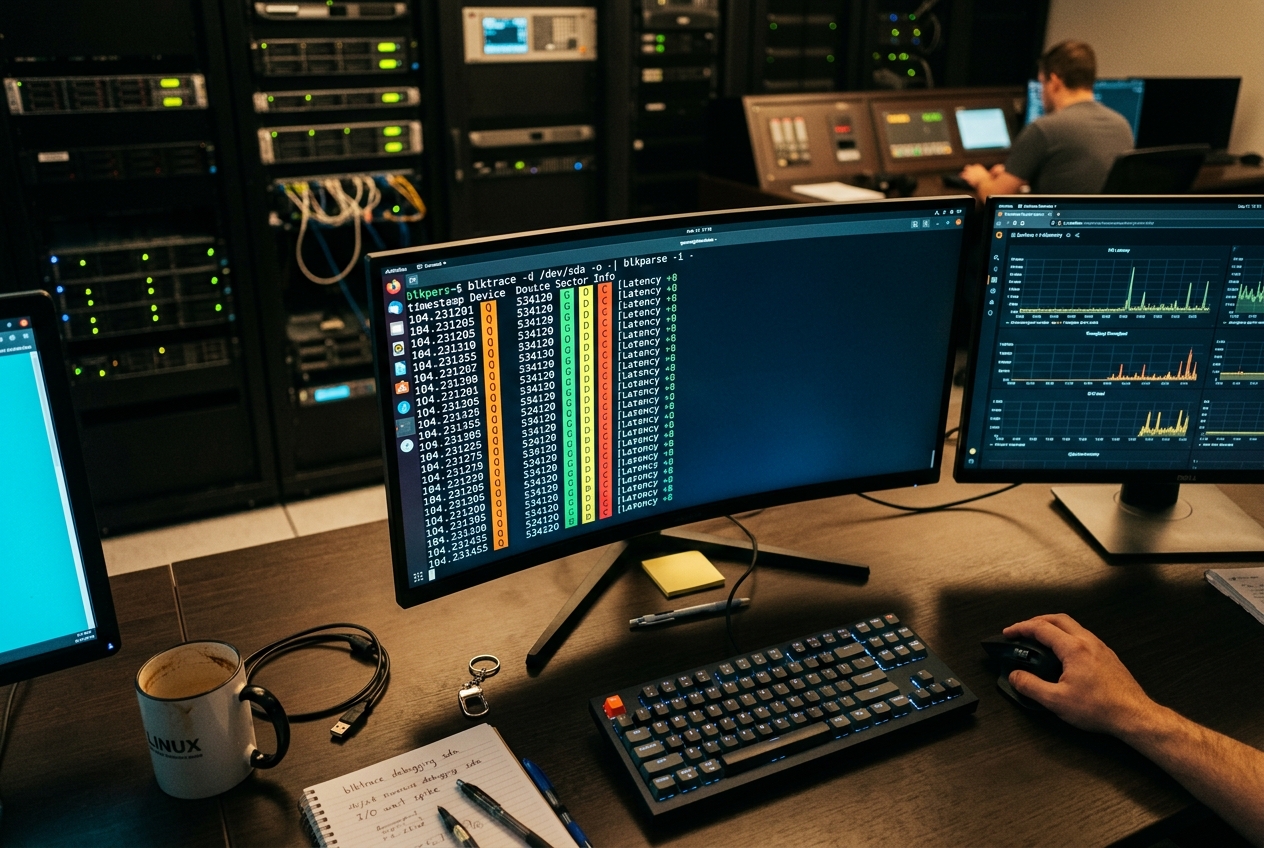
You run your usual triage commands, but the operating system claims everything is completely fine. The processor is idling, free memory is abundant, and storage utilization sits comfortably at a placid 35%. Yet application threads are freezing in uninterruptible sleep, and write operations that normally take a single millisecond are stalling for half a second.
This diagnostic wall occurs because standard performance tools like top, vmstat, and iostat only report broad, smoothed-out averages. They show you the climate over several seconds, but hide the microsecond lightning strikes that cripple high-throughput systems. When average metrics lie, you must peer beneath the file system directly into the Linux kernel's storage machinery.
To break through the fog, you can tap into the block layer and stream live operations straight to your terminal with a single command:
blktrace -d /dev/nvme0n1 -w 5 -o - | blkparse -i -
In just five seconds, this pipeline captures the exact microsecond an input/output (I/O) request arrives at the kernel, how long it lingers in software queues, when it crosses the PCIe bus to physical hardware, and when the drive controller acknowledges completion.
What It Does in Plain English
Every time a program reads a file, flushes a database transaction, or writes a log, the request embarks on a journey. It starts in user space, passes through the Virtual File System (VFS) and the page cache, queues up in the Linux kernel block layer, travels across hardware buses, and finally lands on physical flash memory or magnetic platters.
The blktrace utility acts as an ultra-high-speed recording camera stationed inside the Linux storage subsystem. Instead of guessing where delays happen, blktrace logs discrete events for every piece of data moving through the storage pipeline.
By capturing per-event timestamps, sector offsets, process IDs, and queue transitions, it turns opaque storage latency into a clear, chronological narrative. You can pinpoint with mathematical precision whether a lag spike was caused by an operating system lock, background batch contention, or a struggling solid-state drive (SSD) controller performing internal garbage collection.
How Linux Handles Storage: The Block Layer Lifecycle
To interpret block layer telemetry, it helps to understand the journey an I/O request makes through the modern Linux multi-queue (blk-mq) storage architecture.
The Seven-Stage Lifecycle Matrix
When an application thread initiates I/O, the operation moves through distinct stages, each marked by a specific letter code in blktrace:
- Queue (
Q): The I/O descriptor (struct bio) enters the block layer viasubmit_bio(). This marks the formal entry point. - Merge (
M): The kernel checks whether the incoming data is physically adjacent to a request already waiting in line. If so, it merges them into a single larger request, boosting efficiency. - Get Request (
G): If the request cannot be merged, the kernel allocates a new tracking descriptor (struct request). - Sleep (
S): If the drive's queue depth is exhausted and no hardware descriptors are available, the calling thread is put into uninterruptible sleep until resources free up. - Plug (
P) / Unplug (U): The CPU queue is briefly "plugged" to allow neighbouring requests to accumulate and merge, before being "unplugged" to flush down the line. - Insert (
I): The consolidated request enters the operating system scheduler's staging queue. - Dispatch (
D): The block driver passes the request directly to the physical storage controller (such as an NVMe submission queue). - Completion (
C): The physical hardware finishes the operation and fires an interrupt, retiring the request.
Low-Overhead Telemetry: RelayFS and Kernel Tracepoints
Tracing every disk transaction on a system handling 800,000 operations per second would grind a server to a halt if done naively. To avoid distorting the very performance it is trying to measure, blktrace hooks directly into Linux Kernel Tracepoints embedded within the Linux Kernel Block Layer Subsystem.
Data logging bypasses standard file writes entirely. Instead, the kernel writes binary packets into per-CPU lockless memory buffers managed through relayfs (accessible via /sys/kernel/debug/block/<device>/trace). Because each CPU core writes exclusively to its own buffer, lock contention between cores is zero. The userspace collector reads these buffers periodically, keeping overhead below 1–2% of CPU capacity even under heavy enterprise workloads.
The Toolchain Trio
Working with raw block layer telemetry involves three specialized tools:
- blktrace(8): The low-level collector. It activates kernel tracepoints and captures raw binary event streams across CPU cores.
- blkparse(1): The stream parser. It sorts binary streams by precise timestamps and produces a clean, human-readable timeline of events.
- btt(1): The Block Trace Toolkit. It aggregates parsed streams into statistical latency breakdowns:
- Q2G: Time spent waiting to allocate a request structure (queue throttling).
- G2I: Time taken to format and place the request into the software queue.
- I2D: Time spent waiting inside the operating system queue before driver dispatch.
- D2C: Pure hardware controller service time (from driver dispatch to hardware completion).
- Q2C: Total end-to-end turnaround latency experienced by the application.
Core Flags & Quick Start Reference
The blktrace utility provides flexible options to control trace scope, buffer sizing, and capture duration:
| Flag | Parameter | Description |
|---|---|---|
-d, --dev |
<path> |
Path to the target block device node (e.g., /dev/nvme0n1, /dev/sda). |
-a, --act-mask |
<mask> |
Filters capture by action type (queue, issue, complete, merge, etc.). |
-o, --output |
<prefix> |
File prefix for binary trace logs, or - to stream to standard output. |
-w, --stopwatch |
<seconds> |
Sets a timer to automatically stop tracing after the specified duration. |
-b, --buffer-size |
<KiB> |
Size of per-CPU kernel memory sub-buffers (default: 512 KiB; increase for high IOPS). |
-n, --num-sub-buffers |
<count> |
Number of per-CPU sub-buffers allocated in kernel memory (default: 4). |
-l, --listen |
N/A | Starts in network daemon mode to receive traces sent from remote nodes. |
-h, --host |
<hostname> |
Streams live trace packets over the network to an analysis workstation. |
Inspecting Live Request Lifecycles
To run a fast five-second diagnostic on a live device without creating temporary files on disk:
blktrace -d /dev/nvme0n1 -w 5 -o - | blkparse -i -
Example Output:
  259,0    3        1     0.000000000 14822  Q  WS 20971520 + 8 [postgres]
  259,0    3        2     0.000001240 14822  G  WS 20971520 + 8 [postgres]
  259,0    3        3     0.000001890 14822  I  WS 20971520 + 8 [postgres]
  259,0    3        4     0.000002810 14822  D  WS 20971520 + 8 [postgres]
  259,0    1        1     0.000048120     0  C  WS 20971520 + 8 [0]
This trace details an 8-sector (4 KiB) Synchronous Write (WS) from PostgreSQL (PID 14822) targeting sector 20971520 on device 259,0:
- The request moved from initial arrival (Q) to hardware dispatch (D) in just 2.81 microseconds.
- The physical storage device processed the write and triggered a completion interrupt (C) 45.31 microseconds later.
- Total turnaround time: 48.12 microseconds.
5 Production Real-World Scenarios
1. Diagnosing Latency Spikes on High-Throughput NVMe Drives
Scenario
An NVMe SSD hosting a production cache cluster suffers intermittent multi-millisecond pauses under peak load. You need to determine whether the delay comes from the Linux kernel scheduler or the drive's internal flash controller.
Execution
blktrace -d /dev/nvme0n1 -w 10 -b 4096 -n 8 -o - | blkparse -i - -f "%D %2c %8s %5T.%9t %5p %2a %3d %11S + %5N [%C]\n"
Terminal Output
259,0  6      104   12.482019481  8102  Q   R 1844674407370 + 64 [mysqld]
259,0  6      105   12.482020211  8102  G   R 1844674407370 + 64 [mysqld]
259,0  6      106   12.482021020  8102  I   R 1844674407370 + 64 [mysqld]
259,0  6      107   12.482022190  8102  D   R 1844674407370 + 64 [mysqld]
259,0  2      412   12.518429104     0  C   R 1844674407370 + 64 [0]
Line-by-Line Telemetry Analysis
- Line 1 (
Q): MySQL thread8102queues a 64-sector (32 KiB) Read (R) request at timestamp12.482019481on CPU core 6. - Lines 2–3 (
G,I): The kernel allocates a request header and inserts the operation into the staging queue in under 1.5 microseconds. - Line 4 (
D): The NVMe driver dispatches the request across the PCIe bus to the drive at timestamp12.482022190. - Line 5 (
C): The drive signals hardware completion at timestamp12.518429104on CPU 2.
Calculating the hardware duration (D2C):
12.518429104 s - 12.482022190 s = 0.036406914 s (36.41 ms)
The Linux kernel handled the request in just 2.71 microseconds, but the physical NVMe drive took 36.41 milliseconds to return data.
What the Admin Does Next
The operating system is innocent. The bottleneck lies entirely within the physical SSD. Check the drive's health and controller telemetry with nvme smart-log /dev/nvme0n1 to see if background NAND garbage collection or thermal throttling is active, and verify whether a vendor firmware update resolves known read-disturb latency spikes.
2. Isolating Process Contention and Write Starvation
Scenario
A database write-ahead log (wal_writer, PID 14092) is stalling. You suspect an unthrottled background analytics job (batch_etl, PID 28411) is flooding the storage bus with heavy sequential writes and starving critical transactions.
Execution
blktrace -d /dev/sda -a issue -a complete --filter-by-pid 14092,28411 -w 15 -o - | blkparse -i -
Terminal Output
  8,0    1        1     0.104281902 28411  D  WM 83886080 + 2048 [batch_etl]
  8,0    1        2     0.104284100 28411  D  WM 83888128 + 2048 [batch_etl]
  8,0    1        3     0.104286201 28411  D  WM 83890176 + 2048 [batch_etl]
  8,0    0        4     0.104289110 14092  D  WS 12582912 + 16   [wal_writer]
  8,0    2       89     0.189491200     0  C  WM 83886080 + 2048 [0]
  8,0    2       90     0.214012900     0  C  WM 83888128 + 2048 [0]
  8,0    2       91     0.238910010     0  C  WM 83890176 + 2048 [0]
  8,0    3       92     0.239102400     0  C  WS 12582912 + 16   [0]
Line-by-Line Telemetry Analysis
- Lines 1–3 (
D): Process28411(batch_etl) floods the hardware queue with three consecutive 1 MiB (2048sector) Write Merged (WM) chunks. - Line 4 (
D): Process14092(wal_writer) dispatches a tiny 8 KiB (16sector) Synchronous Write (WS) microseconds later. - Lines 5–7 (
C): The drive hardware services the massive 1 MiB background writes first. - Line 8 (
C): The critical write-ahead log write finishes at0.239102400, forced to wait 134.8 milliseconds behind bulk sequential transfers.
What the Admin Does Next
Enforce cgroup v2 storage controls to isolate the background worker and protect database latency:
# Set bandwidth and IOPS ceilings on the batch analytics job
echo "8:0 rbps=10485760 wbps=10485760 riops=1000 wiops=1000" > /sys/fs/cgroup/batch_jobs/io.max

# Give priority weight to the database service
echo "8:0 10000" > /sys/fs/cgroup/database/io.weight
3. Remote Multi-Host Tracing Without Disk Overhead
Scenario
You need to profile a saturated storage server in a Ceph or SAN cluster. Writing gigabytes of trace logs to the server's local drives would distort your test results (the observer effect). You must stream binary telemetry over a dedicated management network to a separate analysis workstation.
Execution
Step 1: Start the listener on your analysis workstation (192.168.100.50)
blktrace -l -p 2525
Step 2: Start headless remote capture on the production storage node (192.168.100.10)
blktrace -d /dev/sdb -h 192.168.100.50 -p 2525 -w 30
Workstation Terminal Output
server: waiting for connections...
server: connection from 192.168.100.10
server: connected to 192.168.100.10
server: start tracing /dev/sdb
server: end tracing /dev/sdb
The daemon saves per-CPU binary trace streams directly onto the analysis machine:
ls -lh 192.168.100.10-sdb.blktrace.*
-rw-r--r-- 1 root root  42M Aug 20 07:15 192.168.100.10-sdb.blktrace.0
-rw-r--r-- 1 root root  48M Aug 20 07:15 192.168.100.10-sdb.blktrace.1
-rw-r--r-- 1 root root  41M Aug 20 07:15 192.168.100.10-sdb.blktrace.2
-rw-r--r-- 1 root root  45M Aug 20 07:15 192.168.100.10-sdb.blktrace.3
What the Admin Does Next
Parse and analyse the remote streams locally without having consumed a single byte of disk bandwidth on the production host:
blkparse -i 192.168.100.10-sdb -d sdb_remote.dump
4. End-to-End Latency Breakdown with btt
Scenario
A Fibre Channel SAN volume (/dev/mapper/mpatha) is experiencing random stalls. You need clear statistical evidence to prove whether the delay originates inside the Linux host's I/O scheduler (Q2D) or within the external SAN fabric and storage array (D2C).
Execution
Step 1: Capture 60 seconds of raw block events
blktrace -d /dev/mapper/mpatha -w 60 -o mpatha_trace
Step 2: Parse binary streams into a combined dump
blkparse -i mpatha_trace -d mpatha.dump > /dev/null
Step 3: Generate statistical distributions with btt
btt -i mpatha.dump -o btt_analysis
Generated Analysis (btt_analysis.avg)
==================== All Activities ====================
ALL               MIN             AVG             MAX           TOTAL
---------------------------------------------------------------------
Q2Q       0.000000812     0.000042109     0.012481029         1492081
Q2G       0.000000210     0.000001812     0.000491024         1492081
G2I       0.000000401     0.000002104     0.000109201         1492081
I2D       0.000000910     0.000015904     0.001920194         1492081
D2C       0.000184910     0.014298102     0.489102911         1492081
Q2C       0.000191201     0.014317922     0.490102910         1492081

==================== Activity Percentages ====================
Activity                 Percentage of Total Q2C
------------------------------------------------
Q2G (Get Request)                 0.012 %
G2I (Insert)                      0.014 %
I2D (Scheduler Delay)             0.111 %
D2C (Device Service)             99.861 %
| Metric | Scope | Average Time | Percentage of Total Latency |
|---|---|---|---|
Total Turnaround (Q2C) |
End-to-end request lifecycle | 14.317 ms | 100.00% |
Device Service (D2C) |
Physical SAN / Controller hardware | 14.298 ms | 99.86% |
Operating System (Q2D) |
Linux kernel queue & scheduler | 0.019 ms | 0.14% |
Peak Device Delay (D2C Max) |
Worst-case controller spike | 489.10 ms | — |
Deep Metrics Breakdown
Q2G(1.81 µs avg): Request descriptor allocation was instant; no queue exhaustion occurred.I2D(15.90 µs avg): The Linux multi-queue scheduler dispatched requests almost immediately.D2C(14.29 ms avg; 489.10 ms max): The external SAN storage hardware accounted for 99.86% of all latency.
What the Admin Does Next
Do not waste time adjusting Linux kernel elevators or sysfs queue tunables. Present this btt statistical breakdown to your storage vendor or SAN infrastructure team. The problem lies beyond the Host Bus Adapter (HBA)—inside optical switch routing, controller cache eviction policies, or background RAID parity rebuilds.
5. Detecting Unaligned and Split I/O Operations
Scenario
Following migration to a modern flash array with 4096-byte physical sectors (4Kn), an active database experiences an unexpected drop in throughput. You suspect an unaligned partition boundary is splitting single database writes across sector boundaries, doubling the physical I/O workload.
Execution
blktrace -d /dev/nvme0n1 -a split -a merge -w 10 -o - | blkparse -i -
Terminal Output
  259,0    0        1     0.001920194 30112  X  WS 2049 + 7 [mysqld]
  259,0    0        2     0.001920810 30112  X  WS 2056 + 1 [mysqld]
  259,0    2        3     0.002481029 30112  M  WS 4096 + 8 [mysqld]
  259,0    2        4     0.002481912 30112  M  WS 4104 + 8 [mysqld]
Line-by-Line Telemetry Analysis
- Lines 1–2 (
X): The kernel logs a Split event (X) on an 8-sector (4096-byte) write submitted at sector2049. Because sector 2049 is not aligned with 4 KiB boundaries (2049 % 8 = 1), the block layer must split the operation into a 7-sector write (2049 + 7) and a 1-sector write (2056 + 1). - Lines 3–4 (
M): Aligned writes submitted at sector4096merge smoothly (M) without splitting.
Every single misaligned 4 KiB write generates two separate physical hardware operations, doubling controller IOPS and triggering expensive read-modify-write cycles on the flash storage.
What the Admin Does Next
- Re-align the partition table using
partedso boundaries begin on precise 1 MiB or 2 MiB boundaries:bash parted -a optimal /dev/nvme0n1 mkpart primary ext4 2048s 100% - Format the file system with block sizes matching the underlying physical geometry:
bash
   mkfs.xfs -f -s size=4096 -b size=4096 /dev/nvme0n1p1
Operational Pitfalls & How to Avoid Them
1. The Local Trace Feedback Loop
- The Pitfall: Running
blktrace -d /dev/sdaon a system where your current directory or/var/logresides on/dev/sda. Tracing disk writes generates trace data, which writes to disk, generating more trace data. This feedback loop quickly exhausts disk queues and fills storage. - Recovery: Always log traces to a RAM disk (
tmpfs), a dedicated secondary drive, or across the network:bash mkdir -p /mnt/ramdisk && mount -t tmpfs -o size=2G tmpfs /mnt/ramdisk cd /mnt/ramdisk && blktrace -d /dev/sda -w 10
2. Dropped Trace Events Under High IOPS
- The Pitfall: On systems handling over 300,000 IOPS,
blkparsemay warn that events were lost:text You have dropped events, consider increasing allocation buffers (-b / -n) Total throughput: 812904 events, 14201 dropped - Recovery: Increase the per-CPU kernel relay sub-buffer size and pool count before starting the trace:
bash
  blktrace -d /dev/nvme0n1 -b 4096 -n 16 -o - | blkparse -i -
3. Missing debugfs Mount
- The Pitfall: Running
blktracefails with:text debugfs not mounted at /sys/kernel/debug Could not start trace for /dev/sda - Recovery: Mount the debug file system with root privileges:
bash
  mount -t debugfs debugfs /sys/kernel/debug
Choosing the Right Tool: Storage Diagnostic Comparison
Different performance tools operate at different layers of the Linux kernel. Use this guide to select the right tool for the job:
| Diagnostic Tool | Kernel Layer | System Overhead | Primary Strength |
|---|---|---|---|
iostat |
VFS / Sysfs Counters | Minimal (<0.1%) | Fast time-averaged throughput, IOPS, and device utilization percentages. |
iotop |
Taskstats / Netlink | Low (<1.0%) | Identifying which processes are actively reading or writing data. |
eBPF / biosnoop |
Dynamic Kernel Probes | Low (<1.5%) | Fast latency distribution histograms and kernel call-stack inspection. |
blktrace / btt |
Multi-Queue Tracepoints | Moderate (1–2%) | Microsecond-accurate state machine lifecycle tracking (Q, G, I, M, D, C). |
Further Reading & Authoritative References
- blktrace(8) Linux System Architecture Manual
- blkparse(1) Event Parsing Documentation
- btt(1) Block Trace Toolkit Specification
- Linux Kernel Block Layer Subsystem Core Documentation
- Linux Kernel Tracepoint Engine Architecture
- ArchWiki Storage Profiling & Benchmarking Architecture
Today's Takeaway
When your monitoring dashboards show mysterious storage latency that standard tools fail to explain, remember that averages conceal the true bottlenecks.
Log into a test machine right now, verify that debugfs is mounted (mount -t debugfs debugfs /sys/kernel/debug), and run a quick five-second trace on your primary disk:
blktrace -d /dev/nvme0n1 -w 5 -o - | blkparse -i -
Watch the microsecond transitions between Q (queued), D (dispatched), and C (completed). By seeing how individual requests move through the Linux block layer, you elevate storage troubleshooting from guesswork to precise, deterministic engineering.