Potential Instability & Layer Lifting Dynamics: How Vertical Moisture Gradients and Whole-Air-Mass Ascent Trigger Explosive Convective Eruptions
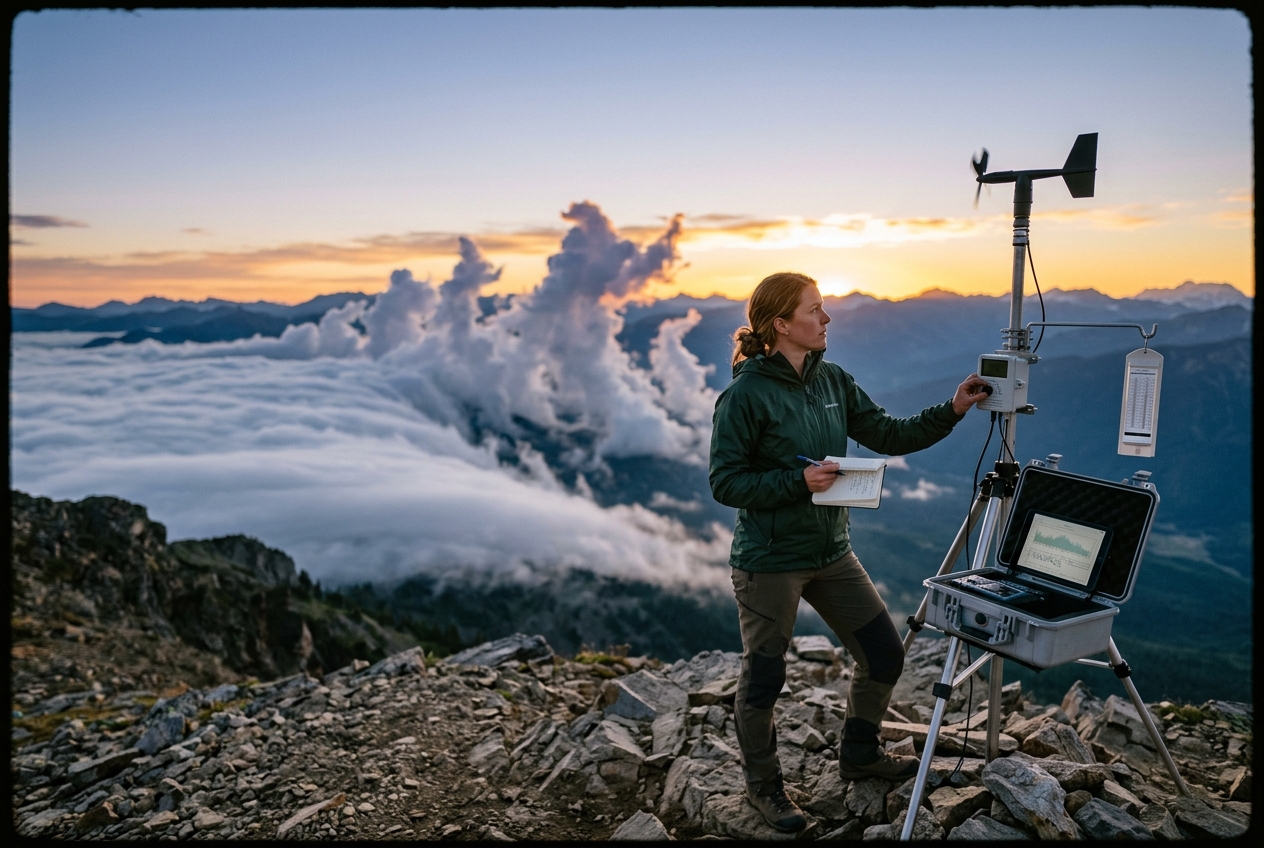
1. The Outdoor Observer's Paradox
Stand upon the windward foothills of a mountain range on a midsummer afternoon, and the atmosphere often presents a portrait of unshakeable serenity. The air at the valley floor is warm and heavy with moisture—a sticky, languid soup that clings to the skin. Yet overhead, the sky is not filled with towering storms, but rather a dull, milky haze terminating in a flat, razor-sharp lid of stratocumulus. A glance at the morning’s meteorological soundings confirms what intuition senses: an impenetrable thermal inversion sits like a slab of tempered glass at eight hundred metres, where temperature actually warms with height. Conventional forecasting metrics point to hefty values of Convective Inhibition (CIN), indicating that no single buoyant bubble of surface air could ever muster the kinetic energy to punch through that invisible ceiling. The mountain lakes remain glassy; the barograph in the cabin library traces an untroubled, horizontal line.
Initial Inversion State (Suppressed):
Height (z)
   ^
   |        Dry, Warm Air Aloft (Low Dew Point)
z2 +-------------------------------------------------- Top of Layer
   |   ================ CAPPING INVERSION ============ (CIN Barrier)
z1 +-------------------------------------------------- Base of Layer
   |        Moist, Humid Boundary Layer Air
---+--------------------------------------------------> Temperature (T)
Then, the broader synoptic engine begins to turn. A subtle barometric trough deepens a hundred miles to the west, or the regional valley breeze organizes into a gentle, steady upslope flow, nudging the entire low-level air mass up the incline at a pedestrian pace of barely thirty centimetres per second. There are no violent updrafts, no explosive surface heating, and no collision of radical air masses.
Yet within ninety minutes, an astonishing metamorphosis unfolds. The flat lid of haze buckles and disintegrates. Slender, turreted cloud towers—Altocumulus castellanus—sprout across the mid-troposphere like the battlements of a fortress, their crenellated tops boiling upward into pristine blue sky. Within another forty minutes, these fragmented turrets merge into a contiguous, anvil-topped supercell. The serene valley is suddenly plunged into darkness, lacerated by cloud-to-ground lightning and pummelled by torrential rain and hail.
Post-Lifting State (Eruption):
Height (z)
   ^                       [ CUMULONIMBUS ANVIL ]
   |                                 / \
   |                                /   \
   |              [ EXPANDING BUOYANT UPDRAFT ]
   |                                ^ ^ ^
   |   Layer Top (Cooled rapidly via Dry Adiabat: -9.8°C/km)
   |   Layer Base (Cooled slowly via Moist Adiabat: -5.0°C/km + Latent Heat)
   |   -------------------------------------------------
   |   RESULT: Superadiabatic, Violent Convective Overturning
---+--------------------------------------------------> Temperature (T)
This sudden atmospheric violence exposes the fundamental paradox of convective dynamics: a sound atmospheric column can be completely stable to isolated parcel displacements, yet simultaneously sit on the precipice of catastrophic instability if the air mass is lifted as an integrated whole. This latent powder keg is what dynamic meteorologists term potential instability (or convective instability).
2. What's Actually Happening: Plain English First
To grasp how a stable sky can abruptly detonate, one must abandon the classic textbook image of the atmosphere as a tranquil pond through which solitary "hot air balloons" (parcels) rise. Instead, consider the atmosphere as a towering, multi-layered sponge cake, where each layer possesses a distinct moisture content and thermal density.
Imagine a thick slab of this atmospheric cake suspended between sea level and one kilometre in altitude. The bottom of the slab rests over a warm, sun-baked marshland; it is saturated with water vapour. The top of the slab, however, extends into bone-dry desert air advected from a continental plateau. Initially, this slab is profoundly stable: the top is warm and buoyant relative to the cool, dense base, producing a rigid temperature inversion that ruthlessly squashes any stray thermal updraft.
       =========================================
       TOP OF SLAB: Bone-Dry, Warm Air
       (Requires immense lifting to reach condensation)
       -----------------------------------------
       BASE OF SLAB: Water-Saturated, Cool Air
       (Condenses almost immediately upon lifting)
       =========================================
Now, imagine an external mechanical wedge—such as a rising mountain flank or an approaching cold front—sliding beneath this entire slab and hoisting it bodily upward into lower ambient pressures.
As the slab ascends, both its base and its top expand and cool. But they do not cool at the same rate.
Because the bottom of the slab is saturated with humidity, it only needs to be lifted a few dozen metres before reaching its Lifting Condensation Level (LCL). The moment it condenses into liquid cloud droplets, water molecules give up their latent heat of vaporization—the energy they absorbed when they originally evaporated. This liberated heat warms the base of the slab, drastically retarding its rate of cooling as it continues to climb. It cools at the gentle moist adiabatic lapse rate (roughly $4^\circ\text{C}$ to $6^\circ\text{C}$ per kilometre).
Meanwhile, the top of the slab is bone-dry. It can be lifted hundreds of metres without ever reaching saturation. Deprived of latent heat release, it cools at the ferocious, unmitigated dry adiabatic lapse rate of nearly $9.8^\circ\text{C}$ per kilometre.
What happens when the ceiling of a room drops in temperature at twice the speed of the floor? The vertical temperature difference across the slab collapses, reverses, and goes into free fall. Within an hour of whole-layer lifting, the top of the slab becomes freezing cold while the bottom remains buoyant and warm. The stabilizing capping inversion is not merely worn away; it is mechanically inverted into an environment of extreme thermodynamic instability, triggering spontaneous, runaway convective overturning.
3. Thermodynamic Foundations & Governing Equations
To formalize this mechanism, atmospheric dynamicists rely on conserved thermodynamic tracer variables rather than absolute temperature alone. The definitive parameter governing this behavior is the Equivalent Potential Temperature ($\theta_e$).
Defining the State Variable: $\theta_e$
Potential temperature ($\theta$) represents the temperature an air parcel would achieve if compressed or expanded dry-adiabatically to a standard reference pressure $p_0 = 1000\text{ hPa}$:
$$\theta = T \left( \frac{p_0}{p} \right)^{\frac{R_d}{c_p}}$$
where $R_d \approx 287.058\text{ J}\cdot\text{kg}^{-1}\text{K}^{-1}$ is the gas constant for dry air, and $c_p \approx 1005\text{ J}\cdot\text{kg}^{-1}\text{K}^{-1}$ is the isobaric specific heat capacity, yielding Poisson's constant $\kappa = \frac{R_d}{c_p} \approx 0.286$.
However, dry potential temperature fails when phase changes occur. The Equivalent Potential Temperature ($\theta_e$) accounts for the total enthalpy of the air-vapour system by simulating the pseudoadiabatic extraction of all latent heat: it is the temperature a parcel would attain if lifted until every molecule of water vapour condensed and fell out as precipitation, with the resulting latent heat warming the dry parcel, which is subsequently brought back to $1000\text{ hPa}$.
An accurate analytical formulation (derived from Betts and Bolton) is expressed as:
$$\theta_e \approx \theta \exp\left( \frac{L_v(T) \cdot r_s(T, p)}{c_p T_{LCL}} \right)$$
where: - $L_v \approx 2.501 \times 10^6\text{ J}\cdot\text{kg}^{-1}$ is the latent heat of vaporization, - $r_s$ is the saturation mixing ratio at the condensation level, - $T_{LCL}$ is the absolute temperature at the parcel's lifting condensation level.
Alternatively, meteorologists frequently evaluate the Wet-Bulb Potential Temperature ($\theta_w$), which is monotonically related to $\theta_e$ via a one-to-one thermodynamic mapping along moist pseudoadiabats.
       ===============================================================
       THE CANONICAL CRITERION FOR POTENTIAL INSTABILITY:

                     ∂θ_e / ∂z < 0   or   ∂θ_w / ∂z < 0
       ===============================================================
The Mathematical Criterion for Potential (Convective) Instability: A macroscopic layer of the atmosphere is potentially unstable if and only if its equivalent potential temperature decreases with height: $$\frac{\partial \theta_e}{\partial z} < 0 \quad \iff \quad \frac{\partial \theta_w}{\partial z} < 0$$
Disentangling Conditional vs. Potential Instability
A common point of confusion in classical meteorology is the distinction between conditional instability and potential instability. They describe fundamentally different physical states and response mechanisms:
| Diagnostic Property | Conditional Instability | Potential (Convective) Instability |
|---|---|---|
| Primary Governing Variable | Environmental Lapse Rate: $\Gamma = -\frac{\partial T}{\partial z}$ | Vertical Gradient of Moist Enthalpy: $\frac{\partial \theta_e}{\partial z}$ |
| Domain of Application | Infinitesimal, isolated air parcel | Finite, macroscopic atmospheric layer ($\Delta z$) |
| Instability Condition | $\Gamma_m < \Gamma < \Gamma_d$ | $\frac{\partial \theta_e}{\partial z} < 0$ |
| Required Trigger | Localized vertical impulse exceeding Convective Inhibition (CIN) to reach LFC | Large-scale, whole-layer mechanical lifting ($\Delta Z_{lift}$) |
| Initial Sounding Appearance | Often shows steep lapse rates; uncapped or weakly capped | Frequently appears unconditionally stable or strongly capped by an inversion ($\frac{\partial T}{\partial z} > 0$) |
Under conditional instability, an isolated parcel will accelerate buoyantly if lifted past its Level of Free Convection (LFC). If the ambient lapse rate $\Gamma$ is less than the saturated adiabatic lapse rate $\Gamma_m$, the layer is unconditionally stable to parcel displacement.
Under potential instability, the ambient lapse rate $\Gamma$ can initially be isothermal or even an inversion ($\Gamma < 0$). However, because the lower boundary of the layer contains vastly more moisture than the upper boundary ($r_1 \gg r_2$), lifting the entire layer forces the base to condense first, causing the internal lapse rate across the layer to destabilize dynamically.
4. The Mechanics of Whole-Layer Lifting on a Skew-T Log-P Diagram
To visualize this process on a thermodynamic chart such as a Skew-T Log-P diagram, consider a finite atmospheric layer bounded between geopotential heights $z_1$ (base) and $z_2$ (top), with initial pressure thickness $\Delta p = p_1 - p_2$.
Pressure (hPa)
   ^
   |        [Top: z2, p2] ---- Dry: (T2, Td2) ---> Cools at Γd (-9.8°C/km)
   |              |
   |              |  Uniform Ascent: ΔZ_lift
   |              v
   |        [Base: z1, p1] --- Moist: (T1, Td1) --> Reaches LCL1 fast!
   |                                                Cools at Γm (-5.0°C/km)
---+--------------------------------------------------------------------> Temperature
The Differential Saturation Mechanism
Let the base of the layer have temperature $T_1$ and dew-point temperature $T_{d1}$, while the top has temperature $T_2$ and dew-point temperature $T_{d2}$. The dew-point depression is defined as $(T - T_d)$.
The vertical displacement $\Delta Z_{LCL}$ required for any sub-layer to reach saturation during dry adiabatic ascent is given to a close approximation by:
$$\Delta Z_{LCL} \approx C \cdot \left( T - T_d \right)$$
where $C \approx 125\text{ m}\cdot^\circ\text{C}^{-1}$ in the lower troposphere.
In a potentially unstable profile, the base is moist while the top is dry: $$\left( T_1 - T_{d1} \right) \ll \left( T_2 - T_{d2} \right)$$
Consequently: $$\Delta Z_{LCL, 1} \ll \Delta Z_{LCL, 2}$$
When the entire layer experiences a uniform vertical displacement $\Delta Z_{lift}$ such that: $$\Delta Z_{LCL, 1} < \Delta Z_{lift} < \Delta Z_{LCL, 2}$$
the base of the layer has already saturated and is ascending along a moist pseudoadiabat: $$\left( \frac{dT}{dz} \right)_{base} = -\Gamma_m \approx -5.0^\circ\text{C}\cdot\text{km}^{-1}$$
while the top of the layer remains unsaturated and continues ascending along a dry adiabat: $$\left( \frac{dT}{dz} \right)_{top} = -\Gamma_d \approx -9.8^\circ\text{C}\cdot\text{km}^{-1}$$
Mathematical Proof of Lapse Rate Destabilization
Let us compute the net rate of change of the vertical temperature difference across the layer with respect to vertical lift $Z$:
$$\frac{d(\Delta T)}{dZ} = \frac{d(T_2 - T_1)}{dZ} = \left(\frac{dT_2}{dZ}\right) - \left(\frac{dT_1}{dZ}\right)$$
Substituting the respective adiabatic lapse rates:
$$\frac{d(\Delta T)}{dZ} = -\Gamma_d - (-\Gamma_m) = -(\Gamma_d - \Gamma_m)$$
Since $\Gamma_d \approx 9.8^\circ\text{C/km}$ and $\Gamma_m \approx 5.0^\circ\text{C/km}$, we find:
$$\frac{d(\Delta T)}{dZ} \approx -(9.8 - 5.0) = -4.8^\circ\text{C}\text{ per kilometre of whole-layer lift.}$$
As $\Delta T = T_2 - T_1$ becomes increasingly negative, the modified environmental lapse rate of the layer, $\Gamma_{new} = -\frac{\Delta T_{new}}{\Delta z}$, expands rapidly.
If the layer also undergoes vertical stretching due to mass continuity in a convergent flow field ($\Delta z_{new} > \Delta z_{initial}$), $\Gamma_{new}$ can easily exceed the dry adiabatic lapse rate ($\Gamma_{new} > \Gamma_d$), creating an intrinsically superadiabatic layer aloft that overturns with violent kinetic energy.
Step-by-Step Worked Numerical Demonstration
To illustrate the mathematical reality of this atmospheric destabilization, let us walk through a worked scenario using realistic sounding data from a pre-convective environment.
+------------------------------------------------------------------------------+
|                         INITIAL SOUNDING CONDITIONS                          |
+------------------------------------------------------------------------------+
| Parameter                          | Layer Base (z1)     | Layer Top (z2)    |
+------------------------------------+---------------------+-------------------+
| Geopotential Altitude (z)          | 500 m               | 1,500 m           |
| Layer Depth (Δz)                   |          1,000 m (1.0 km)               |
| Ambient Pressure (p)               | 950 hPa             | 850 hPa           |
| Temperature (T)                    | 20.0 °C (293.15 K)  | 16.0 °C (289.15 K)|
| Dew Point (Td)                     | 18.4 °C (291.55 K)  |  0.0 °C (273.15 K)|
| Dew-Point Depression (T - Td)      | 1.6 °C              | 16.0 °C           |
+------------------------------------------------------------------------------+
Step 1: Evaluate Initial Stability
The initial environmental lapse rate across the layer is:
$$\Gamma_{initial} = -\frac{T_2 - T_1}{z_2 - z_1} = -\frac{16.0^\circ\text{C} - 20.0^\circ\text{C}}{1.5\text{ km} - 0.5\text{ km}} = \frac{4.0^\circ\text{C}}{1.0\text{ km}} = 4.0^\circ\text{C}\cdot\text{km}^{-1}$$
Since $\Gamma_{initial} = 4.0^\circ\text{C/km} < \Gamma_m \approx 5.5^\circ\text{C/km} < \Gamma_d \approx 9.8^\circ\text{C/km}$, the layer is initially unconditionally stable. Any individual air parcel displaced vertically would immediately be cooler than its environment and sink back to its equilibrium position.
Step 2: Compute $\theta_e$ Gradient
-
At the base ($p_1 = 950\text{ hPa}, T_1 = 20^\circ\text{C}, T_{d1} = 18.4^\circ\text{C}$): $$\theta_1 = (20 + 273.15) \left(\frac{1000}{950}\right)^{0.286} \approx 293.15 \times 1.0148 \approx 297.5\text{ K}$$ Mixing ratio $r_1 \approx 14.2\text{ g/kg} = 0.0142\text{ kg/kg}$. $$\theta_{e, 1} \approx \theta_1 \exp\left( \frac{2.5 \times 10^6 \times 0.0142}{1005 \times 291} \right) \approx 297.5 \times \exp(0.121) \approx 335.7\text{ K}$$
-
At the top ($p_2 = 850\text{ hPa}, T_2 = 16^\circ\text{C}, T_{d2} = 0^\circ\text{C}$): $$\theta_2 = (16 + 273.15) \left(\frac{1000}{850}\right)^{0.286} \approx 289.15 \times 1.0475 \approx 302.9\text{ K}$$ Mixing ratio $r_2 \approx 4.5\text{ g/kg} = 0.0045\text{ kg/kg}$. $$\theta_{e, 2} \approx \theta_2 \exp\left( \frac{2.5 \times 10^6 \times 0.0045}{1005 \times 273} \right) \approx 302.9 \times \exp(0.041) \approx 315.6\text{ K}$$
Evaluating the vertical gradient: $$\frac{\Delta \theta_e}{\Delta z} = \frac{315.6\text{ K} - 335.7\text{ K}}{1.0\text{ km}} = -20.1\text{ K}\cdot\text{km}^{-1} \ll 0$$
The criterion $\frac{\partial \theta_e}{\partial z} < 0$ is satisfied. The layer is intensely potentially unstable.
       ===============================================================
       INITIAL STATE:
       Ambient Lapse Rate:    Γ = 4.0 °C/km  (Stable / Sub-Adiabatic)
       Equivalent Potential:  ∂θe/∂z = -20.1 K/km (Potentially Unstable)
       ===============================================================
Step 3: Subject the Layer to $1,000\text{ m}$ of Whole-Layer Lift ($\Delta Z_{lift} = 1.0\text{ km}$)
-
Evolution of the Base ($z_1$): - Height to reach LCL: $\Delta Z_{LCL, 1} \approx 125 \times (20.0 - 18.4) = 125 \times 1.6 = 200\text{ m}$. - For the first $200\text{ m}$, the base cools dry adiabatically ($\Gamma_d = 9.8^\circ\text{C/km}$): $$T_{base, LCL} = 20.0^\circ\text{C} - (9.8 \times 0.2\text{ km}) = 20.0 - 1.96 = 18.04^\circ\text{C}$$ - For the remaining $800\text{ m}$ ($0.8\text{ km}$) of lift, the base cools moist pseudoadiabatically ($\Gamma_m \approx 5.2^\circ\text{C/km}$): $$T_{base, final} = 18.04^\circ\text{C} - (5.2 \times 0.8\text{ km}) = 18.04 - 4.16 = 13.88^\circ\text{C}$$
-
Evolution of the Top ($z_2$): - Height to reach LCL: $\Delta Z_{LCL, 2} \approx 125 \times (16.0 - 0.0) = 125 \times 16.0 = 2,000\text{ m}$. - Because the total lift is only $1,000\text{ m}$, the top never reaches its LCL. It cools dry adiabatically across the full ascent: $$T_{top, final} = 16.0^\circ\text{C} - (9.8 \times 1.0\text{ km}) = 16.0 - 9.8 = 6.20^\circ\text{C}$$
Step 4: Compute the New Environmental Lapse Rate ($\Gamma_{new}$)
Assuming uniform layer ascent without vertical stretching ($\Delta z_{final} = 1.0\text{ km}$):
$$\Gamma_{new} = -\frac{T_{top, final} - T_{base, final}}{\Delta z} = -\frac{6.20^\circ\text{C} - 13.88^\circ\text{C}}{1.0\text{ km}} = \frac{7.68^\circ\text{C}}{1.0\text{ km}} = 7.68^\circ\text{C}\cdot\text{km}^{-1}$$
       ===============================================================
       POST-LIFTING STATE (After 1,000 m Ascent):
       Base Temperature:      T1' = 13.88 °C (Saturated, in-cloud)
       Top Temperature:       T2' =  6.20 °C (Unsaturated)
       New Lapse Rate:        Γ_new = 7.68 °C/km
       Saturated Lapse Rate:  Γ_m   ≈ 5.0  °C/km

       RESULT: Γ_new > Γ_m  ---> ABSOLUTELY UNSTABLE TO SATURATED MOTION
       ===============================================================
In its new state, the layer's lapse rate ($7.68^\circ\text{C/km}$) dramatically exceeds the saturated adiabatic lapse rate ($\Gamma_m \approx 5.0^\circ\text{C/km}$). Because the entire lower portion of the layer is now fully saturated with cloud water, every parcel within that lower layer experiences instantaneous, positive buoyant acceleration:
$$a_z = g \left( \frac{T_{parcel} - T_{env}}{T_{env}} \right) > 0$$
The original stable lid has been transformed into a zone of spontaneous, explosive convection.
5. Real-World Case Studies & Synoptic Triggers
Potential instability does not detonate in a vacuum; it requires a macroscopic dynamic mechanism capable of hoisting deep atmospheric layers across broad geographical fronts. In nature, two primary mechanisms drive this destabilization.
OROGRAPHIC ASCENT TRIGGER:                 FRONTAL OVERRUNNING (ISENTROPIC UPGLIDE):
Wind ---> [ Mountain Barrier ]             Dry Slot Aloft (Low θe) -------->
               |                                            / / / / / / / / / /
               v                                           /  Warm Conveyor Belt
      Forced Layer Lifting                                /   (High θe Plume)
               |                                         / ---------------------
               v                                        /  Shallow Cold Air Dome
    Differential Saturation                            /------------------------
Case 1: Orographic Ascent over Coastal Mountain Barriers
One of the most spectacular displays of potential instability occurs when maritime tropical air masses encounter steep topographical barriers, such as the Cascade Range of the Pacific Northwest, the European Alps, or the Southern Alps of New Zealand.
As a warm, moisture-laden Pacific atmospheric river moves inland, it frequently develops a stratified internal structure: a saturated boundary layer capped by a dry, subsiding continental air layer flowing from the intermountain plateau. As documented by the World Meteorological Organization (WMO) Cloud Atlas, the mechanical forcing as this air mass meets the mountain flanks forces the entire layer upward.
The low-level moisture condenses rapidly along the coastal foothills, releasing latent heat, while the dry mid-level air above cools at nearly $10^\circ\text{C/km}$. By the time the air mass reaches the mountain crest, the capping inversion is obliterated, and intense, elevated convection produces extreme orographic precipitation, flash flooding, and severe alpine squalls.
Case 2: Isentropic Upglide & Elevated Convection in Frontal Overrunning
In the Great Plains of North America and across central Europe, potential instability is the primary driver of nocturnal severe weather. During these events, a warm, moist low-level jet advects Gulf of Mexico moisture northward, where it encounters a sloping, stationary cold front.
The warm air does not punch through the cold front; rather, it glides smoothly up the sloping isentropic ($\theta$) surfaces over the shallow, dense cold dome—a process known as isentropic ascent.
If a dry, elevated mixed layer (EML) originating from the arid southwestern plateaus overlies this ascending moist conveyor belt ($\frac{\partial \theta_e}{\partial z} \ll 0$), the gradual slope-lift of $500$ to $1,000\text{ metres}$ over a six-hour period completely destabilizes the mid-troposphere.
Because the surface remains locked in cool, stable air beneath the frontal inversion, ground observers detect no convective danger—until severe, elevated supercells erupt above the inversion, producing massive hail and damaging downdrafts that penetrate the cold dome from above.
6. Field Diagnostics & Practical Outdoor Guidance
For mountaineers, sailors, pilots, and field meteorologists, recognizing potential instability before it detonates is critical. Because ground-level instruments may register high barometric pressure and stable surface lapse rates, observers must look for the visual and instrumental signatures of layer-wide moist destabilization.
       ===============================================================
       FIELD OBSERVER'S EARLY WARNING HIERARCHY
       ===============================================================
       1. VISUAL:     Altocumulus castellanus (Ac cas) turrets at 3–5 km.
       2. BAROMETRIC: Steady, minor pressure drop (0.5–1.5 hPa/hr).
       3. HYGROMETRIC: Surface dew point remains high; dry upper winds.
       4. CRITICAL DISPLACEMENT THRESHOLD: ΔZ_crit ≈ 125 × (T_top - Td_top)
       ===============================================================
Visual Sky Cues: The Herald of the Turreted Sky
The definitive visual harbinger of active mid-tropospheric potential destabilization is Altocumulus castellanus (Ac cas).
Visual Cloud Anatomy (Altocumulus castellanus):
             | | |      | | |      | | |    <-- Turreted convective tops
          +--+ +-+------+ +-+------+ +--+
          |                             |   <-- Common, flat horizontal base
          +-----------------------------+       at mid-levels (3,000–5,000 m)
Unlike ordinary fair-weather cumulus, which have roots in surface thermals and broad bases near the ground, Altocumulus castellanus form high in the mid-troposphere (typically between $3,000\text{ m}$ and $5,000\text{ m}$). They are characterized by a flat, continuous horizontal base from which miniature, tower-like vertical plumes erupt, resembling the battlements of a medieval castle.
When you see Altocumulus castellanus in the mid-morning sky, it is visual proof that a mid-tropospheric layer has reached its saturation point, released its potential instability, and is actively overturning. Even if the surface air feels calm, cool, and stable, the presence of castellanus indicates that any further large-scale ascent will result in deep, organized cumulonimbus development by early afternoon.
For detailed identification keys on cloud morphometry, consult the UK Met Office Cloud Guide.
Instrumental Telemetry & Trend Analysis
- Aneroid Barometer / Altimeter: Watch for steady, low-amplitude pressure falls ($0.5\text{ to }1.5\text{ hPa}$ per hour). This does not indicate a classic storm center, but rather the broad synoptic-scale upward motion necessary to lift deep tropospheric layers.
- Sling Psychrometer / Hygrometer: Measure the surface dew-point depression $(T - T_d)$. If surface air exhibits a high dew point ($T_d > 16^\circ\text{C}$ in temperate zones) while mid-level wind vectors indicate dry, fast-moving air crossing perpendicular mountain ridges, a steep vertical gradient of equivalent potential temperature ($\frac{\partial \theta_e}{\partial z} < 0$) is almost certainly present.
- Wind Profiling: Veering winds with height (winds turning clockwise with increasing altitude in the Northern Hemisphere) indicate warm air advection and associated large-scale isentropic lifting through the column.
The Field Calculus: Estimating Critical Lift ($\Delta Z_{crit}$)
Field meteorologists and outdoor leaders can estimate the critical vertical displacement ($\Delta Z_{crit}$) required to fully unlock convective instability across a capped layer using a simple rule of thumb:
$$\Delta Z_{crit} \approx 125 \times \left( T_{top} - T_{d, top} \right) \quad \text{[meters]}$$
       ===============================================================
       CRITICAL LIFT RULE OF THUMB:

       If the dry layer top has a dew-point depression of 8 °C:
         ΔZ_crit ≈ 125 × 8 = 1,000 meters of forced ascent.

       If an incoming mountain ridge is 1,200 meters high:
         Ascent exceeds ΔZ_crit ---> Destabilization is GUARANTEED.
       ===============================================================
If an air mass with a dry layer top dew-point depression of $8^\circ\text{C}$ is approaching a coastal mountain ridge $1,200\text{ metres}$ in height, the forced orographic ascent ($\Delta Z_{terrain} = 1,200\text{ m}$) exceeds the critical lift threshold ($\Delta Z_{crit} = 1,000\text{ m}$).
The forecaster can assert with mathematical certainty that the capping inversion will be destroyed during transit, converting an apparently tranquil morning into a severe thunderstorm outbreak on the mountain passes.
For deeper computational frameworks on convective parameterizations, researchers often reference tools provided by the University Corporation for Atmospheric Research (UCAR) COMET Program.
7. Today's Meteorological Rule of Thumb
The Golden Law of Layer Lifting: Never trust a tranquil sky capped by an inversion when the low levels are rich in moisture and the mid-levels are dry ($\frac{\partial \theta_e}{\partial z} < 0$). Lift the bottom, it condenses and warms with latent heat; lift the top, it stays dry and turns freezing cold. What began as an impenetrable lid will swiftly invert into an explosive convective engine.
Summary Checklist for the Field Forecaster
- Check the Gradient: Compute equivalent potential temperature with height. If $\frac{\partial \theta_e}{\partial z} < 0$, the atmosphere is potentially unstable, regardless of how stable the current ambient lapse rate appears.
- Identify the Lifting Agent: Look for synoptic fronts, isentropic conveyor belts, or topographical barriers capable of lifting the entire layer by $\Delta Z_{crit}$.
- Scan the Horizon for Battlements: Treat Altocumulus castellanus as the definitive visual signature that layer destabilization is underway aloft.
- Anticipate Rapid Transition: Remember that whole-layer destabilization does not evolve linearly—once saturation is breached, capping inversions collapse abruptly, turning calm mountain valleys into severe storm tracks in under two hours.