Flanking Line Dynamics & Feeder Cell Convection: How Stair-Stepping Cumulus Congestus and Inflow Convergence Fuel Severe Supercells
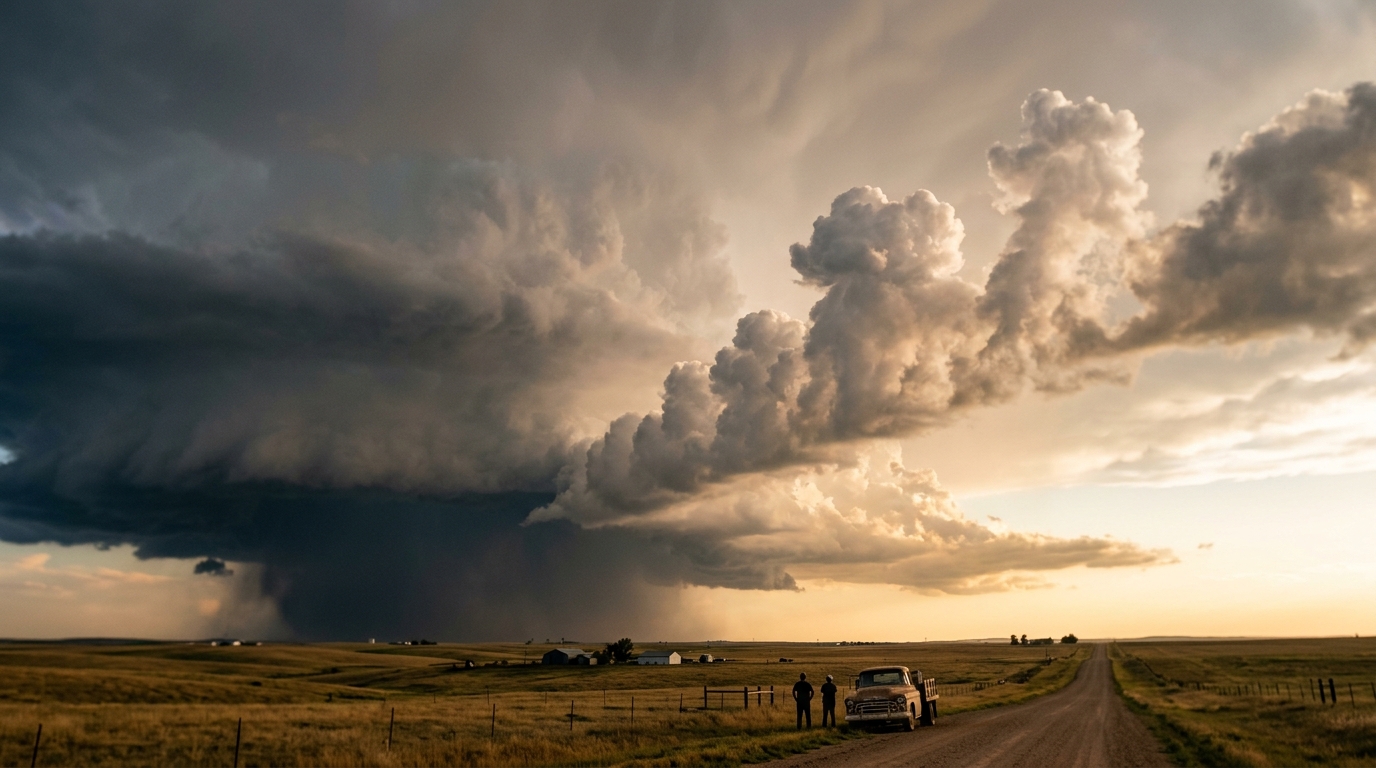
On a sweltering late-spring afternoon across the open plains, the atmosphere often feels taut, poised on the edge of violent transformation. Standing beneath an expansive canopy of warm, moisture-laden air, an outdoor observer feels a persistent, backing wind drawing out of the south-east—warm, humid, and rich with the earthy scent of damp prairie grasses. The barometric pressure on an altimeter begins a subtle, rhythmic fall. To the north-east, the towering, glaciated anvil of an established supercell stretches across the upper troposphere like a colossal vaulted ceiling of striated cirrus, casting an eerie, coppery twilight across the landscape. Yet the storm’s true engine room lies not beneath the dark, rain-curtained core, but miles behind it along the south-western horizon.
       [ UPPER ANVIL / CIRRUS SHIELD ]
                     |
             (Main Mesocyclone)
              /              \
    [Mature Updraft]          [Forward-Flank Downdraft / Heavy Rain]
          ^
          |   (Merger Zone)
    [Tower 3: Cu Congestus]  <--- Rapid Inflow & Tilting Vorticity
        ^
        |
  [Tower 2: Cumulus]
      ^
      |
[Tower 1: Cu Humilis]  <--- RFD Gust Front / Pseudo-Cold Front Forcing
----------------------------------------------------------------------
Warm Inflow Boundary Layer (CAPE > 3000 J/kg) ----> [Cold Pool / RFD Outflow]
There, emerging from the rain-free base and trailing away towards the south-west, stands an ascending colonnade of cumulus towers. Known to severe storm meteorologists and seasoned field spotters as the flanking line, this formation resembles a monumental cloud staircase. Each step is an individual convective tower—progressively taller, crisper, and more energetic the closer it sits to the primary updraft. The air here is charged with dynamic tension; the steady hum of surface winds is punctuated by crisp pressure fluctuations, and the sharp scent of ozone mingles with the warm inflow before the turbulent chill of downdraft air arrives.
1. What Is Actually Happening: The Conveyor Belt of the Sky
To understand the physical machinery of the flanking line, it helps to conceptualise the atmosphere not as an empty void, but as a dense, layered fluid. In an unstable atmosphere primed for severe convection, a reservoir of hot, buoyant air sits trapped near the ground beneath a layer of warm, dry air aloft—a capping inversion that meteorologists call the "lid" or convective cap.
The primary storm updraft acts as an immense atmospheric chimney, venting this pent-up energy into the upper troposphere at speeds that can exceed 50 metres per second. As this central column draws in vast volumes of buoyant air, the storm expels rain-cooled, dense air in its downdrafts. Part of this chilled air sweeps around the rear flank of the storm as the Rear-Flank Downdraft (RFD), spilling across the landscape like a cold hydraulic surge.
            FLANKING LINE / RFD CROSS-SECTION

   South-West                                              North-East
  [Juvenile Tower]    [Developing Tower]     [Mature Feeder Cell]   [Primary Updraft]
        (1)                 (2)                      (3)                   (4)
         |                   |                        |                     |
     [Cu Med]           [Cu Congestus]          [Glaciating Top]      [MESOCYCLONE CORE]
         ^                   ^                        ^                     ^
         |                   |                        |                     |
         +-------------------+------------------------+                     |
                             |                                              |
   WARM INFLOW AIR ----->   / \   <----- FORCED MECHANICAL LIFT             |
  (High Theta-E, Moister)  /   \         ALONG GUST FRONT                   |
  ========================/=====\===========================================|===
  DENSE COLD POOL OUTFLOW (RFD) ----> Spreading Wedge of Chilled Air ------->
Where this expanding pool of cold, dense air collides with the warm, humid environmental air feeding into the storm, it creates a miniature, razor-sharp boundary known as a pseudo-cold front. Because the cold air is significantly denser, it acts as a rigid, advancing physical wedge. As warm, moisture-saturated air is drawn towards the central storm, it strikes this cold wedge and is violently forced upwards.
This forced mechanical ascent shunts parcels of air through the convective cap past their Level of Free Convection (LFC), the altitude at which a rising air parcel becomes warmer than its surrounding environment and accelerates autonomously through buoyant instability.
Because the cold pool continues to advance outward while the main storm tracks downwind, this lifting process occurs sequentially: 1. The youngest, smallest cumulus clouds (cumulus humilis and mediocris) initiate at the distant tail of the boundary. 2. As these parcels ascend and build latent heat through condensation, they erupt into towering cumulus congestus. 3. Carried by mid-level storm-relative winds, these developing towers drift along the boundary directly towards the main updraft, growing exponentially until they are fully ingested into the primary mesocyclone.
For the outdoor observer, distinguishing an active, inflow-dominated flanking line from a decaying, outflow-dominated boundary is vital:
- Inflow-Dominated Flanking Line: Features rock-hard, sharp-edged, cauliflower-like boiling cloud tops. The cloud bases are dark, flat, and uniform, showing laminar bands or striations that lean forward into the storm. Surface winds blow briskly towards the cloud towers from the warm sector.
- Decaying Outflow Boundary: Features soft, ragged, shredded edges (pannus or scud). Cloud tops appear diffuse, sheared apart, or fibrous (premature glaciation), and the surface wind shifts abruptly to cool, gusty outflow blowing away from the cloud line.
Authoritative documentation on convective initiation and cloud identification can be explored through the World Meteorological Organization International Cloud Atlas and the Met Office Cloud Guide.
2. The Science: Mass Budgets, Kinematics, and Vorticity
Beyond its visual grandeur, the flanking line is a fundamental kinematic conduit. It solves a classic thermodynamic problem: how a solitary supercell can sustain an intense, non-hydrostatic pressure drop and an updraft processing millions of tonnes of air per second without exhausting its immediate boundary-layer reservoir.
A. The Inflow Mass Flux Equation
The mass budget of a convective updraft is governed by the continuity equation for compressible fluid flow. We can quantify the mass transport delivered by the flanking line's feeder channel into the primary storm core using the mass flux formulation:
$$\dot{M} = \rho \cdot A \cdot v_{\text{inflow}}$$
Where: * $\dot{M}$ is the mass flux ($\text{kg}\cdot\text{s}^{-1}$) * $\rho$ is the atmospheric air density at the boundary layer ($\text{kg}\cdot\text{m}^{-3}$) * $A$ is the effective cross-sectional area of the convergence corridor ($A = W \times H$, where $W$ is corridor width and $H$ is boundary-layer depth in metres) * $v_{\text{inflow}}$ is the storm-relative inflow velocity normal to the boundary ($\text{m}\cdot\text{s}^{-1}$)
Let us evaluate a typical Great Plains or High Plains supercell environment using observed physical parameters: * Surface air density ($\rho$) at $T = 28^\circ\text{C}$ and $p = 960\text{ hPa}$: $\approx 1.12\text{ kg}\cdot\text{m}^{-3}$ * Convergence corridor width ($W$): $12\text{ km} = 12,000\text{ m}$ * Inflow layer depth ($H$): $1.8\text{ km} = 1,800\text{ m}$ * Cross-sectional Area ($A$): $12,000\text{ m} \times 1,800\text{ m} = 2.16 \times 10^7\text{ m}^2$ * Storm-relative inflow speed ($v_{\text{inflow}}$): $22\text{ m}\cdot\text{s}^{-1}$ ($\approx 79\text{ km/h}$)
Calculating the mass flux:
$$\dot{M} = 1.12\text{ kg}\cdot\text{m}^{-3} \times (2.16 \times 10^7\text{ m}^2) \times 22\text{ m}\cdot\text{s}^{-1}$$
$$\dot{M} = 5.322 \times 10^8\text{ kg}\cdot\text{s}^{-1} \approx 532,000\text{ tonnes of air per second}$$
Detailed diagnostic formulas for boundary-layer mass convergence are archived in the American Meteorological Society Glossary of Meteorology and technical treatises at the NOAA National Severe Storms Laboratory.
B. Feeder Cell Ingestion Kinematics
Feeder towers develop at discrete intervals along the flanking line and travel northeastward towards the mesocyclone. The ingestion timescale ($\tau_{\text{merge}}$) determines the frequency at which the main updraft receives kinetic and thermodynamic pulses:
$$\tau_{\text{merge}} = \frac{\Delta x}{v_{\text{rel}}}$$
Where: * $\Delta x$ is the linear separation distance between the nascent feeder tower and the main updraft core along the flanking line axis ($\text{m}$) * $v_{\text{rel}}$ is the relative propagation velocity of the feeder cell along the convergence axis toward the mesocyclone ($\text{m}\cdot\text{s}^{-1}$)
Worked Kinematic Example:
Suppose radar analysis reveals a developing cumulus congestus cell initiated along the RFD gust front at a distance $\Delta x = 16\text{ km}$ ($16,000\text{ m}$) from the storm core.
If mid-level steering and low-level convergence accelerate the cell toward the mesocyclone at a storm-relative velocity $v_{\text{rel}} = 20\text{ m}\cdot\text{s}^{-1}$:
$$\tau_{\text{merge}} = \frac{16,000\text{ m}}{20\text{ m}\cdot\text{s}^{-1}} = 800\text{ seconds} \approx 13.3\text{ minutes}$$
Within roughly 13 minutes, a newly formed cloud parcel at the distant edge of the flanking line transforms into a mature, glaciating updraft tower that merges directly into the main vortex.
C. Baroclinic Vorticity Generation and Vertical Tilting
The flanking line is not merely a supplier of air volume; it is an atmospheric vorticity factory. Along the flanking line, an extreme horizontal density gradient exists between the warm, buoyant inflow air ($\theta_v \approx 308\text{ K}$) and the evaporatively chilled RFD air ($\theta_v \approx 298\text{ K}$).
This density mismatch generates horizontal baroclinic vorticity ($\vec{\omega}_{\text{baro}}$) perpendicular to the temperature gradient according to the Bjerknes Circulation Theorem:
$$\frac{d\vec{\omega}}{dt} = \frac{\nabla \rho \times \nabla p}{\rho^2} + (\vec{\omega} \cdot \nabla)\vec{v} - \vec{\omega}(\nabla \cdot \vec{v})$$
As horizontal vortex tubes generated along the cold-pool interface are drawn towards the central core, the intense vertical updraft gradient ($\frac{\partial w}{\partial z} > 0$) tilts these horizontal vortex lines into the vertical axis:
$$\left(\frac{\partial \zeta}{\partial t}\right)_{\text{tilting}} = \left( \frac{\partial w}{\partial x}\frac{\partial v}{\partial z} - \frac{\partial w}{\partial y}\frac{\partial u}{\partial z} \right) = \vec{\omega}_h \cdot \nabla_h w$$
Where $\zeta$ is the vertical component of vorticity, $\vec{\omega}_h$ is the horizontal vorticity vector, and $\nabla_h w$ is the horizontal gradient of vertical velocity.
As feeder cells merge into the main storm, they import pre-existing vertical vorticity and concentrated angular momentum directly into the mid- and low-level mesocyclone, dramatically enhancing low-level vertical wind shear and storm-relative helicity (SRH).
          BAROCLINIC VORTICITY GENERATION & TILTING

           Warm, Buoyant Inflow Air (Low Density)
                         |
  [Horizontal Vortex Tube Generated:  \vec{\omega}_h = \nabla \rho \times \nabla p ]
                         |
         Cold RFD Outflow Wedge (High Density)
                         |
                         V
  =================[ TILTING ZONE ]=================
                         |
        Intense Updraft Velocity Gradient (\nabla_h w)
                         |
                         V
  [Tilted Vertical Vorticity Vector (\zeta > 0) Ingested into Mesocyclone]
Researchers tracking these vortex dynamics utilise resources from the NOAA Storm Prediction Center and computational modules from UCAR MetEd / COMET Program.
3. Cyclic Mesocyclogenesis and Storm Longevity
One of the greatest puzzles of early radar meteorology was why classic supercells could persist for five, eight, or even twelve hours across hundreds of kilometres, far outliving the lifespan of an ordinary single-cell thunderstorm (typically 30–45 minutes). The answer lies in the rhythmic, cyclic replenishment driven by flanking line mergers.
A supercell updraft is in constant peril of dynamic self-destruction. As rain and hail accumulate in the storm’s forward-flank downdraft (FFD) and rear-flank downdraft (RFD), cold outflow threatens to undercut the primary updraft, wrapping around its low-level circulation like a noose. This process is known as mesocyclone occlusion. During occlusion, the primary updraft loses contact with the warm boundary-layer inflow and chokes, while the associated low-level tornado decays into a rope-like filament.
                  CYCLIC MESOCYCLONE OCCLUSION & REBIRTH

    Stage 1: Occlusion                  Stage 2: Feeder Merger & Rebirth

    [Old Updraft / Occluding Meso]       [Dying Meso 1]     [NEW UPSTREAM MESO 2]
               |                                                   ^
        (Cut off by RFD)                                           | (Absorbs Feeder Cell)
               |                                                   |
     [Cold Outflow Surges]           ----->        [FLANKING LINE / FEEDER TOWER 3]
               |                                                   ^
    [Flanking Line Intact]                                         | (Inflow Re-established)
However, the flanking line acts as an upstream relief valve and evolutionary successor:
- Thermodynamic Rejuvenation: As the old mesocyclone occludes, the convergence zone at the apex of the flanking line surges. The maturest feeder cell (Tower 3 in the schematics) undergoes rapid dynamic pressure perturbation drops ($\nabla p' < 0$) due to internal spin, drawing the main inflow axis toward itself.
- Kinetic Handover: The feeder tower rapidly expands in diameter, establishes its own non-hydrostatic vertical pressure gradient, and assumes the mantle of the primary mesocyclone.
- Cyclic Tornadogenesis: As the newly formed mesocyclone takes over, it re-establishes a clean, buoyant inflow channel. This structural reset initiates a new cycle of rear-flank downdraft surges, low-level vorticity stretching, and potential cyclic tornadogenesis.
Without the continuous train of feeder cells supplied by the flanking line, supercells would execute a single lifecycle and collapse. The flanking line transforms a transient convective burst into a quasi-steady-state atmospheric engine.
4. Field Observation and Spotter Checklist
For meteorologists, field spotters, and discerning outdoor observers, the flanking line is the single most informative visual structure for diagnosing storm health, severe hazard potential, and future storm trajectories.
+---------------------------------------------------------------------------------------+
|                       FIELD SPOTTER FLANKING LINE DIAGNOSTIC                          |
+------------------------------------+--------------------------------------------------+
| Visual Sky Indicator               | Meteorological Implication                       |
+------------------------------------+--------------------------------------------------+
| Hard, crisp "cauliflower" towers   | Strong convective available potential energy     |
| with brilliant white tops          | (CAPE); rapid boundary ascent past LFC; healthy  |
|                                    | storm inflow.                                    |
+------------------------------------+--------------------------------------------------+
| Leaning, sheared towers with       | Strong low-to-mid-level vertical wind shear;     |
| laminar striations at base         | optimal storm-relative helicity (SRH) for        |
|                                    | vorticity ingestion.                             |
+------------------------------------+--------------------------------------------------+
| Soft, fibrous, hazy cloud tops     | Dry-air entrainment aloft; poor buoyancy;        |
| with early glaciation (cirrus-like)| impending collapse of flanking line ascent.      |
+------------------------------------+--------------------------------------------------+
| Ragged scud drifting away from     | Outflow dominance; cold pool is undercutting     |
| the towers; sudden chilly wind     | and destroying low-level convective inflow.      |
+------------------------------------+--------------------------------------------------+
A. Instrumental Signatures to Monitor
- Barometric Altimeter / Microbarograph: A sudden, steep drop of $1.5\text{ to }3.5\text{ hPa}$ accompanied by high-frequency pressure perturbations ("inflow troughs") indicates intense dynamic draw into an approaching feeder merger zone.
- Surface Hygrometer & Thermometer: Monitor equivalent potential temperature ($\theta_e$). Sustained high dew points ($>18^\circ\text{C} / 65^\circ\text{F}$) in the inflow air feeding into the flanking line confirm that the storm possesses the thermodynamic fuel required for severe output. A sharp drop in temperature of $\ge 4^\circ\text{C}$ accompanied by gusty winds signals that cold outflow has breached the observation point.
- Wind Vane / Anemometer: Persistent backing of winds (e.g., veering from south-westerly to south-southeasterly) and acceleration to speeds $>15\text{ m}\cdot\text{s}^{-1}$ confirm strong storm-relative inflow entering the feeder staircase.
B. Assessing Large Hail Risk within Feeder Towers
A critical safety hazard often overlooked by field observers is that the youngest, most violent updraft cores frequently reside inside flanking line feeder cells. Because these towers ingest pristine, unpolluted inflow without competition from falling precipitation cascades, their internal updrafts can accelerate upward at $30\text{ to }50\text{ m}\cdot\text{s}^{-1}$.
Hailstones within these isolated towers are suspended in high-liquid-water content zones at temperatures between $-10^\circ\text{C}$ and $-30^\circ\text{C}$, growing rapidly through wet accretion. Observers standing beneath what appears to be an innocent, developing cumulus congestus tower several miles south-west of the main rain core can suddenly be struck by isolated, giant hail stones ejected from the tilted updraft vault.
C. Reading Flanking Line Orientation to Predict Track Deviations
By observing the angle of the flanking line relative to the mid-tropospheric environmental steering flow, observers can anticipate supercell track deviations:
- Right-Moving Supercells (Anticyclonic Shear Vectors): In environments with strong clockwise-curved hodographs, the flanking line typically builds toward the south-southwest. As new feeder cells merge on the right flank, the storm's macroscopic centroid will deviate significantly to the right of the mean atmospheric wind (often turning from a westerly vector to a south-easterly track).
- Speed Deceleration: When the flanking line develops a wide, nearly perpendicular angle to the storm core, the storm will often decelerate in forward translation speed while intensifying rapidly, dramatically increasing local flash flood and long-track tornado potential.
Additional observational techniques and safety standards are detailed in the NOAA SPC Storm Spotter's Guide.
5. Summary & Atmospheric Principles
========================================================================================
                          CORE METEOROLOGICAL SUMMARY
========================================================================================

• STRUCTURAL IDENTITY:
  The flanking line is a linear staircase of cumulus congestus towers initiated along
  the pseudo-cold front produced by the supercell's Rear-Flank Downdraft (RFD).

• MASS CONVEYOR:
  It delivers hundreds of thousands of tonnes of high-CAPE boundary-layer air per second
  directly into the primary mesocyclone (\dot{M} = \rho \cdot A \cdot v_{inflow}).

• VORTICITY GENERATOR:
  Intense horizontal density gradients create baroclinic horizontal vorticity across
  the RFD boundary, which is tilted vertically and amplified during feeder cell merger.

• DYNAMIC LONGEVITY:
  Discrete cell mergers provide the thermodynamic and kinetic energy pulses that drive
  cyclic mesocyclogenesis, preventing storm occlusion and ensuring supercell longevity.
========================================================================================
Today's Meteorological Rule of Thumb
When tracking a severe thunderstorm, do not fixate solely on the dark rain core ahead of you; look to the south-west along the flanking line. If the cloud staircase displays rock-hard, boiling cauliflower towers leaning hard into the main core, the storm’s fuel pump is running at peak capacity, and the mesocyclone is actively renewing its destructive strength.
Authoritative References & Further Reading
- NOAA National Severe Storms Laboratory (NSSL) - Severe Weather Primer
- NOAA Storm Prediction Center (SPC) - Mesoscale Dynamics Library
- World Meteorological Organization (WMO) - International Cloud Atlas
- American Meteorological Society - Glossary of Meteorology: Flanking Line
- Met Office - Convective Storm Dynamics and Cloud Formation