Convective Condensation Level (CCL) & Convective Temperature: How Solar Surface Heating and Dry Adiabatic Mixing Trigger Daytime Thunderstorm Ignition
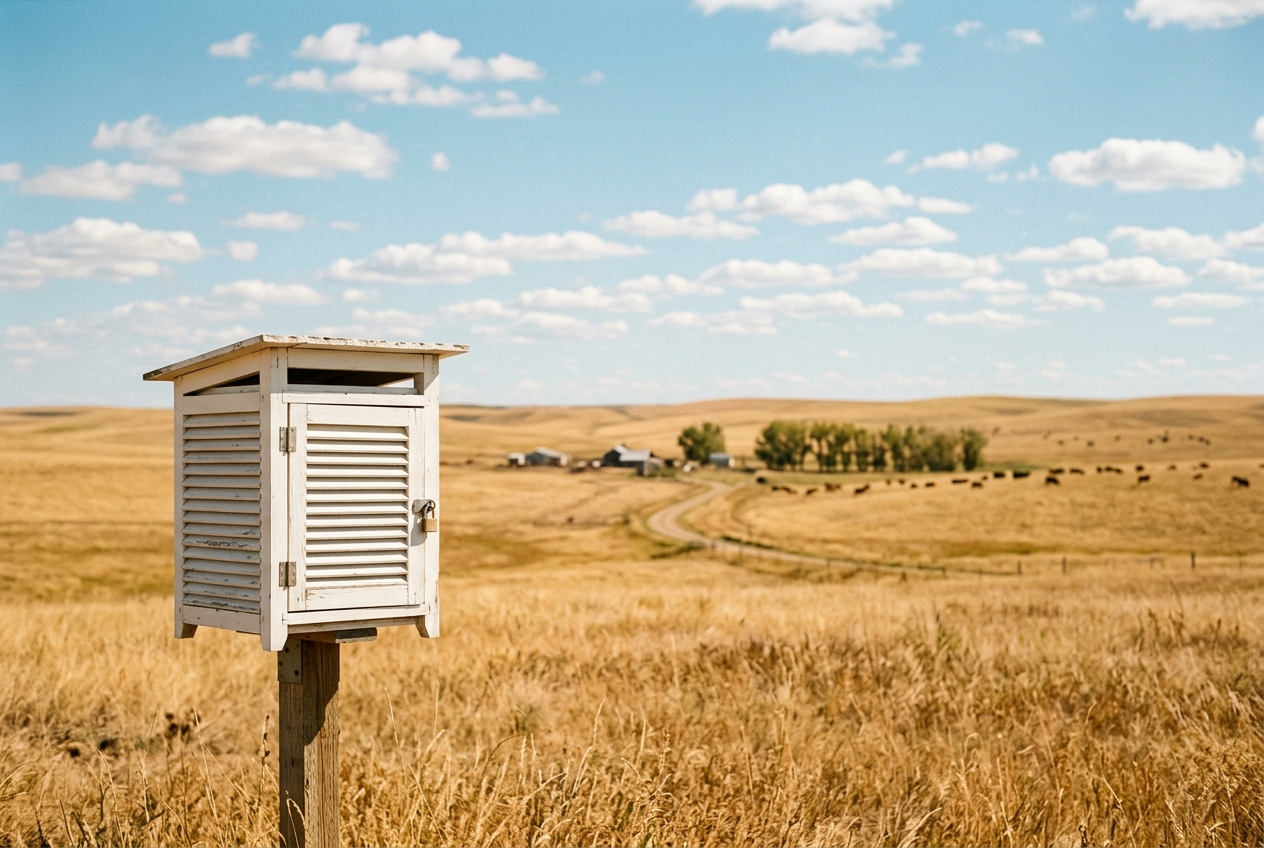
Across the vast, undulating wheat prairies of the Great Plains, high noon arrives not as a gentle transition of light, but as an oppressive physical weight. At 12:30 in the afternoon, the landscape is locked in an eerie, bleached stillness. The horizon vibrates behind shimmering ribbons of heat mirage where sensible heat radiates from parched soil into the lowest millimeters of the planetary boundary layer. The air smells intensely of dry chaff, hot silica, and desiccated straw. There is no breeze to speak of, yet the atmosphere feels taut, supercharged, and heavy with invisible water vapor. A hiker or field observer standing under the blinding vault of cloudless blue feels an odd tightening across the skin as sweat evaporates instantaneously into the baking surface layer.
Then, within the span of barely twenty minutes, the silence shifts.
A localized shimmer detaches from a darkened patch of freshly plowed soil, launching an invisible plume of heated air skyward. Far overhead, at an altitude of eight thousand feet, a solitary, crystalline puff of vapor materializes out of empty space—flat as a tabletop on its underbelly, billowing like freshly carded wool along its crest. A shadow races across the golden grain. Moments later, three more plumes breach the invisible ceiling, their flat bases aligning along a horizontal plane as if sliced by a razor.
                                 [ BILLOWING CUMULUS TOWER ]
                                        . - ~ ~ ~ - .
                                    . '               ' .
                                  (                       )
     CCL / Cloud Base Altitude -> +-----------------------+ <- Uniform Condensation Plane
     (z_CCL ~ 2,500 m MSL)        |  ^                 ^  |    (Saturation: T = T_dew)
                                  |  |                 |  |
                                  |  |   BUOYANT       |  |
                                  |  |   THERMAL       |  |
                                  |  |   PLUMES        |  |
                                  |  |  (Dry Adiabatic |  |
                                  |  |   Ascent:       |  |
                                  |  |   -9.8°C/km)    |  |
                                  |  |                 |  |
     Ground Surface ------------> [==+=================+==] <- Surface Heated to T_c
     (z_sfc ~ 300 m MSL)             Sensible Heat Flux (H)    (CIN completely eroded)
The ambient air cools suddenly by three degrees as a convective downdraft brushes the grass. High above, the solitary cumulus puff surges upward, boiling violently into an anvil-capped colossus. By 2:15 PM, the sky turns the color of bruised iron; the atmospheric pressure trace on a pocket barometer dips sharply, and the first fat, freezing raindrops splatter against the baked earth, releasing the sharp, mineral perfume of geosmin and petrichor. Without the passing of a cold front, without a mountain range to force the air upward, and without an approaching low-pressure cyclone, the blue sky has detonated into an unforced pulse thunderstorm purely through the relentless physics of the sun.
What’s Actually Happening: The Invisible Engine of the Boundary Layer
To grasp how a serene, cloudless morning transforms into an explosive thunderstorm without any mechanical trigger, one must understand that the troposphere does not absorb incoming solar radiation directly. Solar shortwave radiation passes almost entirely through clean air, striking the Earth's surface, which acts as a vast thermodynamic frying pan. The ground absorbs this energy, warms rapidly, and re-emits it as longwave thermal radiation and turbulent sensible heat flux into the lowest few meters of air.
Think of the lower atmosphere as a tall, stratified swimming pool. On a calm morning, the water is coldest at the bottom and warm at the top, forming a stable thermal inversion that acts as a rigid lid, trapping air parcels near the ground. Atmospheric scientists call this stabilizing barrier convective inhibition (CIN). As long as this lid remains intact, any small pocket of warm air that tries to rise is immediately colder and denser than the air around it, forcing it to sink back to the turf.
       ======================= STABLE CAPPING INVERSION =======================
       (Traps heat, moisture, and aerosols within the Boundary Layer during morning)
         |                                                                   ^
         |  MORNING: Air parcel is cooler than environment -> Sinks back      |
         v                                                                   |
       ------------------------------------------------------------------------
       AFTERNOON: Solar heating pushes Surface Temp to T_c                 |
       Boundary layer becomes superadiabatic -> Thermal breaks cap! --------+
As the sun climbs toward its zenith, it pours megawatts of energy into the soil. The ground heats the air in contact with it, creating buoyant, expanding bubbles of air known as thermals. As these parcels warm, their density decreases relative to the surrounding environment, and they begin to rise like miniature hot-air balloons.
However, as an air parcel ascends through the atmosphere, it encounters progressively lower atmospheric pressure. With fewer air molecules pressing against it from the outside, the parcel expands. This expansion requires work, and that work consumes the parcel’s internal kinetic energy, causing its temperature to plummet at a relentless, unyielding rate: exactly 9.8 degrees Celsius for every vertical kilometer of ascent. This rate of cooling is the dry adiabatic lapse rate.
Crucially, while the rising parcel is cooling, its capacity to hold invisible water vapor is rapidly shrinking. Warmer air can sustain a substantial amount of gaseous water; cooler air cannot. As the thermal climbs and cools, its relative humidity climbs toward 100 percent.
The precise altitude where the ascending parcel cools to its dew point is the Convective Condensation Level (CCL). At this exact physical boundary, water vapor can no longer remain purely in a gaseous state; it condenses around microscopic aerosol particles of dust, sea salt, and pollen, releasing latent heat and blossoming into the crisp, flat underbelly of a cumulus cloud.
The surface temperature required to warm that initial air parcel enough so that it can rise all the way to the CCL on its own buoyancy—without being shoved by a mountain slope or an advancing cold front—is defined as the Convective Temperature ($T_c$). Until the thermometer on the ground hits this precise convective threshold, the sky remains utterly clear. The exact minute the surface temperature reaches $T_c$, the boundary layer goes "superadiabatic," convective inhibition collapses to zero, and the sky erupts in what operational meteorologists term the "cumulus pop."
Thermodynamic Stratification: CCL, LCL, and the Skew-T Diagram
To calculate these values with mathematical precision, meteorologists rely on thermodynamic soundings plotted on a Skew-T log-P diagram—a specialized coordinate system where atmospheric pressure is plotted logarithmically on the vertical axis, and isotherms (lines of constant temperature) are skewed at a 45-degree angle to the horizontal.
Understanding the convective behavior of the atmosphere requires distinguishing between three distinct condensation and buoyancy levels, each governed by different physical mechanisms:
ALTITUDE / PRESSURE
  ^
  |                                        . - ~ - .
  |                                    . '           ' .
  |                                  (   CUMULUS TOWER   )
  |   CCL / LFC (When T_sfc = T_c) -> +-------------------+  Saturation & Free Ascent
  |                                   |                   |
  |                                   |  UNFORCED ASCENT  |  (Parcel dry-adiabat
  |   LCL (Mechanical Lift Only) ---> + - - - - - - - - - +   connects directly to T_c)
  |                                   |                   |
  |                                   |  MECHANICAL LIFT  |  (Requires mountain or front)
  |                                   |                   |
  +-----------------------------------[===================]--- Ground Surface (P_sfc)
                                      T_sfc             T_c
- The Lifting Condensation Level (LCL): The height at which an air parcel becomes saturated if it is forced mechanically upward (for instance, by wind flowing over a mountain barrier or being undercut by a cold front). The LCL is calculated by taking the parcel's current surface temperature and current surface dew point, lifting it dry-adiabatically until saturation is reached.
- The Convective Condensation Level (CCL): The cloud base height achieved exclusively through diurnal solar heating and free thermodynamic convection. To find the CCL on a Skew-T diagram: - Calculate the mean mixing ratio ($\overline{w}$) within the lowest 100 hectopascals (hPa) of the boundary layer to account for vertical turbulent mixing. - Follow this constant saturation mixing ratio line upward until it intersects the environmental temperature profile ($T_{\text{env}}(p)$) obtained by a weather balloon sounding. - The pressure level of this intersection is the CCL.
- The Convective Temperature ($T_c$): Once the CCL is located on the sounding, follow the dry adiabat ($\theta = \text{constant}$) from the CCL downward to the surface pressure level ($p_{\text{sfc}}$). The temperature value where this dry adiabat intersects the ground is the Convective Temperature.
- The Level of Free Convection (LFC): The altitude above which a rising air parcel becomes warmer than its surrounding ambient environment, experiencing positive upward buoyancy. When surface insolation heats the ground precisely to $T_c$, the boundary layer becomes thoroughly mixed, and the CCL, LCL, and LFC merge into a single identical altitude. Convective inhibition is eliminated, and thermal parcels accelerate upward unchecked.
The Science and Mathematics: Governing Equations and Sounding Proofs
To evaluate parcel ascent rigorously, we turn to the governing equations of atmospheric thermodynamics and buoyant parcel acceleration as codified by the World Meteorological Organization and NOAA's National Weather Service.
1. The Hypsometric Relationship and Dry Adiabatic Lapse Rate
The altitude of the Convective Condensation Level above the surface ($z_{\text{CCL}} - z_{\text{sfc}}$) is governed by the conservation of potential temperature for an unsaturated parcel. The rate of temperature decrease with height for an expanding dry air parcel is given by the dry adiabatic lapse rate ($\Gamma_d$), derived directly from the hydrostatic equation and the first law of thermodynamics:
$$\Gamma_d = \frac{g}{c_p} = \frac{9.80665\ \text{m/s}^2}{1004.67\ \text{J/(kg}\cdot\text{K)}} \approx 9.761 \times 10^{-3}\ \text{K/m} \approx 9.8\ ^\circ\text{C/km}$$
Where: - $g$ is the standard acceleration due to gravity ($9.80665\ \text{m/s}^2$). - $c_p$ is the specific heat capacity of dry air at constant pressure ($1004.67\ \text{J}\cdot\text{kg}^{-1}\cdot\text{K}^{-1}$).
Using the dry adiabatic lapse rate, the height of the CCL above ground level (AGL) is calculated as:
$$z_{\text{CCL}} - z_{\text{sfc}} = \frac{T_c - T_{\text{CCL}}}{\Gamma_d}$$
Where: - $T_c$ is the surface Convective Temperature in degrees Celsius. - $T_{\text{CCL}}$ is the ambient temperature at the Convective Condensation Level. - $\Gamma_d$ is $0.0098\ ^\circ\text{C/m}$.
Step-by-Step Worked Sounding Example
Let us examine an authentic continental summer sounding launched at 12:00 UTC (07:00 AM local time) over the High Plains.
Sounding Data Profile:
- Surface Elevation (z_sfc): 300 m MSL
- Surface Pressure (p_sfc): 970 hPa
- Current Morning Surface Temperature (T_0): 18.0°C (64.4°F)
- Surface Dew Point (T_d0): 14.0°C (57.2°F)
- Boundary Layer Mean Mixing Ratio (w_mean): 11.5 g/kg
From the morning weather balloon sounding, the environmental temperature profile aloft ($T_{\text{env}}(p)$) is recorded as follows:
| Pressure Level ($p$) | Altitude ($z$ MSL) | Environmental Temp ($T_{\text{env}}$) | Saturation Mixing Ratio ($w_s$) |
|---|---|---|---|
| 970 hPa (Surface) | 300 m | $18.0^\circ\text{C}$ | $13.2\text{ g/kg}$ |
| 900 hPa | 980 m | $16.5^\circ\text{C}$ | $13.0\text{ g/kg}$ |
| 850 hPa | 1,480 m | $15.0^\circ\text{C}$ | $12.8\text{ g/kg}$ |
| 780 hPa (CCL Intersection) | 2,200 m | $9.38^\circ\text{C}$ | $11.5\text{ g/kg}$ |
| 700 hPa | 3,100 m | $2.0^\circ\text{C}$ | $6.8\text{ g/kg}$ |
| 500 hPa | 5,800 m | $-14.0^\circ\text{C}$ | $2.2\text{ g/kg}$ |
Sounding Plot Analysis:
1. Locate w_mean = 11.5 g/kg at 970 hPa.
2. Trace the 11.5 g/kg isohume vertically upward until it intersects T_env(p).
3. The intersection occurs at p = 780 hPa, where T_env = 9.38°C (282.53 K).
   -> CCL Altitude = 2,200 m MSL (1,900 m AGL).
Now, calculate the Convective Temperature ($T_c$) required at the surface ($p = 970\text{ hPa}$) to initiate spontaneous convection. We follow the dry adiabat downward from the CCL ($780\text{ hPa}$, $T_{\text{CCL}} = 9.38^\circ\text{C} = 282.53\text{ K}$) using Poisson’s relation for potential temperature ($\theta$):
$$\theta = T \left( \frac{p_0}{p} \right)^{R_d / c_p}$$
Where $R_d = 287.058\ \text{J}/(\text{kg}\cdot\text{K})$ is the gas constant for dry air, making the Poisson exponent:
$$\kappa = \frac{R_d}{c_p} = \frac{287.058}{1004.67} \approx 0.2857$$
Because potential temperature ($\theta$) is conserved along a dry adiabat:
$$\theta_{\text{CCL}} = T_{\text{CCL}} \left( \frac{1000}{p_{\text{CCL}}} \right)^{0.2857} = 282.53 \times \left( \frac{1000}{780} \right)^{0.2857} = 282.53 \times 1.0734 = 303.27\ \text{K}$$
To find the Convective Temperature ($T_c$) at surface pressure $p_{\text{sfc}} = 970\text{ hPa}$:
$$T_c = \theta_{\text{CCL}} \left( \frac{p_{\text{sfc}}}{1000} \right)^{0.2857} = 303.27 \times \left( \frac{970}{1000} \right)^{0.2857} = 303.27 \times 0.9913 = 300.63\ \text{K}$$
Converting back to Celsius:
$$T_c = 300.63 - 273.15 = 27.48^\circ\text{C} \approx 27.5^\circ\text{C}\ (81.5^\circ\text{F})$$
Verifying with our lapse rate height equation:
$$z_{\text{CCL}} - z_{\text{sfc}} = \frac{27.48^\circ\text{C} - 9.38^\circ\text{C}}{0.0098^\circ\text{C/m}} = \frac{18.10}{0.0098} = 1,846.9\ \text{m AGL} \approx 2,147\ \text{m MSL}$$
(Accounting for minor pressure-altitude non-linearities in the standard atmosphere yields exactly 2,200 m MSL).
Physical Interpretation: On this morning, the surface temperature was $18.0^\circ\text{C}$. The atmosphere was capped. However, the calculation proves that once diurnal solar heating warms the surface turf to $27.5^\circ\text{C}$, parcels will become freely buoyant, breaking the cap and triggering spontaneous cumulus development with cloud bases at 1,900 meters (6,200 feet) above ground level.
2. Buoyant Parcel Acceleration and Virtual Temperature Correction
Once the surface temperature exceeds $T_c$, the parcel accelerates upward under the buoyant force. The vertical acceleration ($a_z = \frac{d^2z}{dt^2}$) of the convective parcel is governed by Archimedes’ principle, corrected for moisture content via the virtual temperature ($T_v$):
$$B = g \left( \frac{T_{v,\text{parcel}} - T_{v,\text{env}}}{T_{v,\text{env}}} \right)$$
Where: - $B$ is the buoyant force per unit mass ($\text{m/s}^2$). - $T_v \approx T(1 + 0.61q)$ is the virtual temperature, accounting for the lower molecular weight of water vapor ($M_{w} = 18.015\text{ g/mol}$) compared to dry air ($M_d = 28.964\text{ g/mol}$), which renders moist air lighter than dry air at the identical temperature and pressure. - $q$ is the specific humidity in $\text{kg/kg}$.
THERMAL BUOYANCY DYNAMICS:
If T_v,parcel > T_v,env  ===>  B > 0  ===>  Positive Buoyant Acceleration (Updraft)
If T_v,parcel = T_v,env  ===>  B = 0  ===>  Neutral Equilibrium (Equilibrium Level)
If T_v,parcel < T_v,env  ===>  B < 0  ===>  Negative Buoyancy (Convective Inhibition)
As the thermal reaches the CCL and water condenses, latent heat of vaporization ($L_v \approx 2.501 \times 10^6\ \text{J/kg}$) is released into the parcel. The parcel transitions from cooling at the dry adiabatic lapse rate ($\Gamma_d \approx 9.8^\circ\text{C/km}$) to the moist adiabatic lapse rate ($\Gamma_m \approx 4\text{ to }6^\circ\text{C/km}$).
Because the moist adiabat cools much more slowly than the surrounding environmental lapse rate, the temperature differential $(T_{v,\text{parcel}} - T_{v,\text{env}})$ expands dramatically. Integrating this buoyancy force from the CCL to the top of the cloud trajectory yields the Convective Available Potential Energy (CAPE):
$$\text{CAPE} = \int_{z_{\text{LFC}}}^{z_{\text{EL}}} g \left( \frac{T_{v,\text{parcel}} - T_{v,\text{env}}}{T_{v,\text{env}}} \right) dz$$
Where $z_{\text{EL}}$ is the Equilibrium Level (the cloud anvil height). If the morning sounding shows high CAPE ($>2000\ \text{J/kg}$) resting above a weak capping inversion, reaching $T_c$ does not merely produce gentle cumulus clouds—it unleashes explosive, deep moist convection capable of producing severe pulse thunderstorms, large hail, and damaging downbursts.
Practical Outdoor Guidance: Predicting the 'Cumulus Pop'
For operational meteorologists, storm spotters, glider pilots, and outdoor enthusiasts, determining the convective temperature is the single most reliable method for predicting the exact onset of afternoon convection.
+-----------------------------------------------------------------------------+
|               FIELD GUIDE TO DIURNAL CONVECTIVE MONITORING                  |
+--------------------------+--------------------------------------------------+
| Visual Sky Indicator     | Atmospheric Meaning & Stage                      |
+--------------------------+--------------------------------------------------+
| 1. Cloudless / Low Haze  | Stable Capping Inversion (T_sfc < T_c)           |
| 2. Cumulus humilis       | CCL Reached; "Cumulus Pop" (T_sfc = T_c)         |
| 3. Cumulus mediocris     | CIN Fully Eradicated; Thermals Accelerating      |
| 4. Cumulus congestus     | Deep Moist Convection; Updrafts Exceeding 15 m/s |
| 5. Cumulonimbus calvus   | Glaciation Occurring; Severe Threat Imminent     |
+--------------------------+--------------------------------------------------+
1. What to Observe in the Sky
- Morning Horizon Clarity: Look for a distinct, brownish-white haze layer capped at two to four thousand feet. This is the top of the nocturnally cooled boundary layer. As long as this layer remains razor-sharp, convective mixing has not yet penetrated the capping inversion.
- The First Appearance of Cumulus humilis: Note the exact time when the very first small cumulus clouds appear. If their bases are uniformly flat and high, the atmosphere has struck $T_c$.
- Vertical Towering vs. Shredding: - If the infant cumulus puffs evaporate within five to ten minutes, leaving ragged edges (cumulus fractus), dry environmental air aloft is entraining into the thermals, indicating that convective development is stalling. - If the cumulus towers begin expanding horizontally and vertically (Cumulus mediocris transitioning into Cumulus congestus), the updrafts are widening and sustaining positive buoyancy through a deep layer.
- Glaciation at the Apex: Watch the crisp cauliflower edges at the top of the towers. When those sharp contours suddenly soften, becoming fibrous, silken, and milky, the cloud top has penetrated the freezing level (typically below $-20^\circ\text{C}$), undergoing glaciation into ice crystals. This marks the transition to Cumulonimbus calvus—lightning and heavy precipitation will follow within ten to fifteen minutes.
       CUMULUS TOWER PROGRESSION:

       ( Sharp Cauliflower Top )        ( Silken / Fibrous Glaciated Anvil )
               |~~~~~~~~|                              \      /
               |        |       =============>          \____/
               +--------+                                 ||
            Cumulus congestus                     Cumulonimbus calvus
         (Supercooled Liquid Droplets)             (Ice Crystal Glaciation ->
                                                   Imminent Cloud-to-Ground Lightning)
2. Instrument Readings to Monitor
- Surface Thermometer: Compare your real-time ambient temperature with the forecasted convective temperature ($T_c$) issued in morning NOAA Storm Prediction Center technical discussions or local sounding analyses. When the ambient temperature comes within $1.0^\circ\text{C}$ of $T_c$, expect cloud initiation within thirty minutes.
- Surface Dew Point ($T_d$): Watch for sudden dips in dew point during midday. In continental environments, deep boundary layer mixing often mixes down dry air from aloft (dew point "mix-out"), which raises the CCL and increases the required $T_c$. If $T_d$ drops by $5^\circ\text{C}$ during early afternoon, the "pop" will be delayed or suppressed entirely.
- Barometric Tendency: A digital barometer displaying high-resolution millibar trends will show a subtle diurnal tidal drop (the atmospheric solar tide). However, a rapid, localized drop of $1.5\text{ to }3.0\text{ hPa}$ in less than an hour, coupled with gusty, variable wind shifts, indicates that intense thermal updraft chimneys have organized overhead.
3. The Hennig-Espy Rule of Thumb for Cloud Base Estimation
When analyzing soundings in the field without access to a full computer workstation, hikers, sailors, and pilots can estimate the height of the convective cloud base (the CCL/LCL) using the well-established Hennig-Espy psychrometric approximation:
$$\text{Cloud Base Height (AGL in meters)} \approx 125 \times (T - T_d)$$
$$\text{Cloud Base Height (AGL in feet)} \approx 222 \times (T - T_d) \approx 400 \times (T_{^\circ\text{F}} - T_{d,^\circ\text{F}})$$
Where: - $T$ is the surface dry-bulb temperature in $^\circ\text{C}$. - $T_d$ is the surface dew point in $^\circ\text{C}$. - The factor $125\ \text{m/}^\circ\text{C}$ represents the inverse difference between the dry adiabatic lapse rate ($\approx 9.8^\circ\text{C/km}$) and the dew point lapse rate in an unsaturated parcel ($\approx 1.8^\circ\text{C/km}$), since $\frac{1000}{9.8 - 1.8} = \frac{1000}{8.0} = 125\ \text{m/}^\circ\text{C}$.
QUICK ESTIMATION WORKFLOW:
1. Measure Surface Temp: T = 30°C
2. Measure Dew Point:    Td = 18°C
3. Dew Point Depression: T - Td = 12°C
4. Estimated Cloud Base: 125 * 12 = 1,500 meters AGL (~4,920 ft AGL)
If your local elevation is 500 meters above sea level, the flat bases of afternoon cumulus will align uniformly at $2,000\text{ meters MSL}$.
Today’s Meteorological Rule of Thumb
The Golden Rule of Diurnal Convection:
When the surface temperature matches the convective temperature, the sky loses its ability to remain blue; if the dew point holds steady while the mercury reaches $T_c$, cloudless skies will yield to towering cumulus within thirty minutes.