Cirrus Uncinus & Ice Fallstreak Dynamics: How Crystal Sedimentation and Vertical Wind Shear Carve Mare's Tails Across the Upper Troposphere
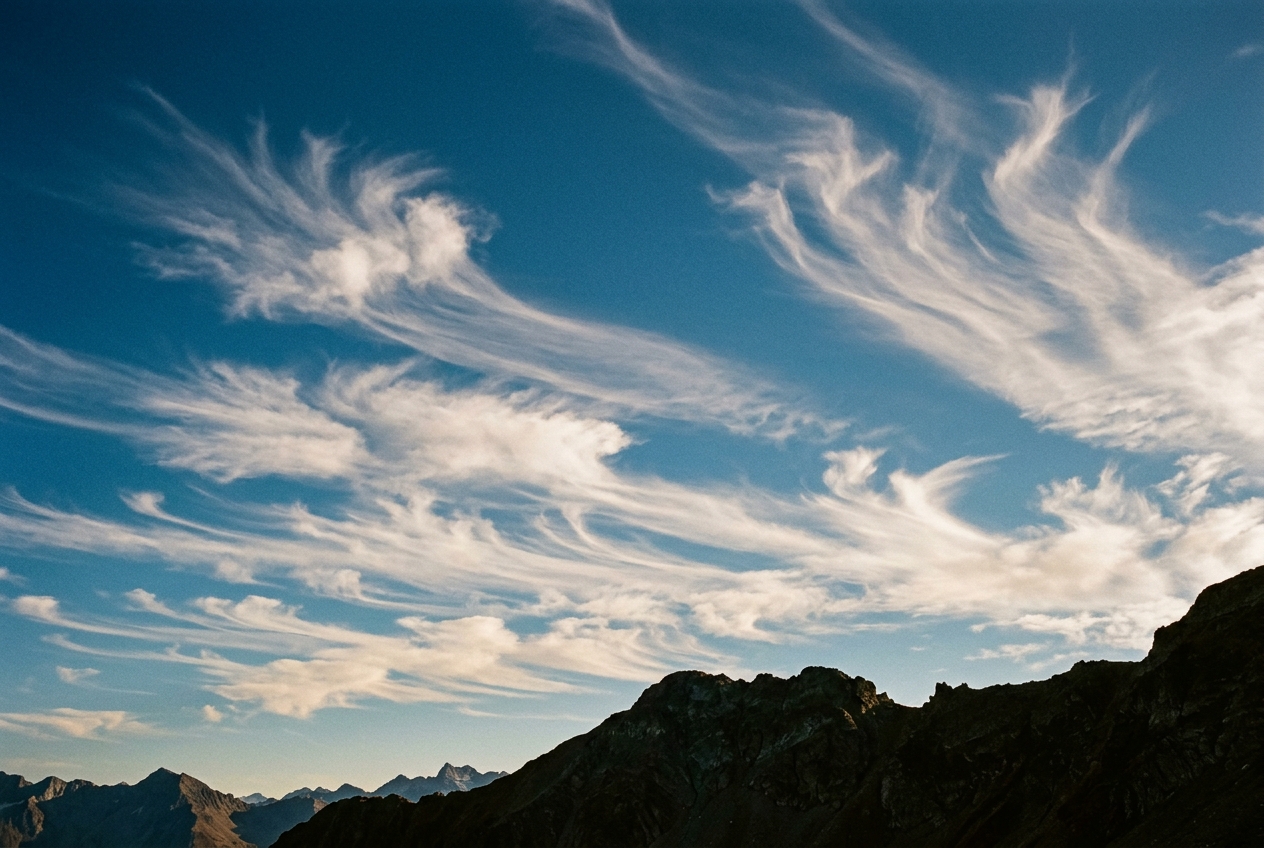
High above the weather we feel, delicate hooks of ice carve the wind. These cirrus uncinus clouds are not merely decorative brushstrokes, but precise fluid-mechanical instruments tracing wind shear, ice microphysics, and the slow, inevitable approach of storm fronts.
1. The Ghost in the Azure
Step onto an open ridge in mid-autumn, and the world often presents an illusion of absolute stillness. The ground is dry, smelling faintly of desiccated pine needles and cooling loam. The surface air is crisp, biting lightly at your collar, while the mercury sits motionless at a comfortable fifteen degrees Celsius. If you glance at an aneroid barometer resting on your field table, its needle stands placid and stubborn at 1022 hectopascals—a firm, reassuring dome of high pressure.
Yet if you cast your gaze directly overhead, the atmosphere tells a radically different story.
Against the deep, crystalline cobalt of the upper troposphere, the sky is being scored by long, fibrous plumes of brilliant white. They look remarkably like the swept-back locks of a galloping horse—the folklore "mare’s tails" known to mariners for centuries. Each filament begins at a sharp, compact comma-head and sweeps downward across the heavens in an elegant, drawn-out brushstroke that curls gently at its terminus.
Altitude
  ^
  |        [ Generating Head ]  (Ice Nucleation & Updraft: w ~ 0.5 m/s)
8-12 km           ***
                 * * *
                /
               /  <-- Descending Fallstreak (v_t ~ 0.8 m/s)
              /
             /    <-- Strong Horizontal Wind Shear (u(z) increases/decreases)
            /
           /____  <-- Sublimation Boundary / Virga Terminus
  |
  +--------------------------------------------------------> Horizontal Drift (x)
As you stand there in the late afternoon sun, nothing around you appears to move. There is no surface gust to rustle the grass; no low, brooding shelf cloud darkens the horizon; no smell of ozone or impending petrichor hangs on the wind. Yet those ethereal hooks ten kilometres above are traveling at more than one hundred and forty kilometres per hour. They are plunging through invisible rivers of air, evaporating into thin air before they can touch the ground, and silently signaling that the calm beneath your feet has already begun its terminal countdown.
2. What’s Actually Happening — The Anatomy of a High-Altitude Hook
To understand what carves these giant icy commas, it helps to imagine the atmosphere not as a single body of air, but as a towering layered cake. Down where we live and breathe, the sponge is dense, warm, and relatively moist. But as you climb past the cruising altitude of commercial jetliners—between 8 and 12 kilometres above sea level—the air thins to a fraction of its surface density, and the temperature plunges far below minus forty degrees Celsius.
In this deep freeze, liquid water cannot exist in an ordinary state. If a pocket of moist air is nudged upward even slightly, the water vapour does not condense into round liquid droplets like the ones in a summer fog; it crystallizes directly into shimmering, microscopic seeds of ice.
A cirrus uncinus cloud—from the Latin uncinus, meaning "hooked"—is composed of two entirely distinct physical zones acting in concert:
- The Generating Head (The Comma’s Dot): This is the localized "factory" of the cloud. It is a small, buoyant bubble of air, often just a few hundred metres across, rising gently at speeds of less than one metre per second. Inside this tiny updraft, moisture is converted into millions of prismatic ice crystals.
- The Fallstreak or Virga (The Comma’s Tail): Once these ice crystals grow large and heavy enough, the feeble updraft can no longer support them. They spill out of the generating head and begin to fall under gravity toward the Earth.
Why, then, do these falling crystals not drop in a straight vertical plumb line?
Think of dropping a feather out of the window of a car moving down a motorway. The feather does not fall straight down to the asphalt; the rush of oncoming air drags it backward, stretching its path into an elongated slant. In the upper troposphere, different layers of air move at drastically different horizontal velocities—a phenomenon known as vertical wind shear.
As our ice crystals tumble downward through thousands of feet of sky, they drop from fast-moving winds into slower-moving winds (or vice versa). Because the crystals take twenty to forty minutes to fall through these distinct atmospheric storeys, the horizontal wind constantly displaces them sideways. The resulting trail is a frozen physical graph of the wind speed differences across the upper atmosphere, drafted in suspended ice.
3. The Science: Microphysics, Fluid Dynamics, and Shear Kinematics
For those wishing to peer into the exact mathematical and thermodynamic machinery governing these clouds, cirrus uncinus represents a textbook intersection of non-equilibrium thermodynamics, aerosol microphysics, and kinematic fluid transport.
3.1. Ice Nucleation and Crystal Habit
At altitudes between 8 and 12 km, temperatures universally reside below the homogeneous freezing threshold of water, $T < -38.1^\circ\text{C}$ ($235\text{ K}$). Under these conditions, the formation of ice does not strictly require heterogeneous ice-nucleating particles (INPs). Instead, supercooled liquid solution droplets spontaneously freeze via homogeneous nucleation whenever relative humidity with respect to ice ($RH_i$) exceeds roughly 140% to 160%.
Once nucleated, the crystals grow rapidly via direct vapor deposition (the Bergeron–Findeisen process), driven by the vapor pressure deficit between the ambient supersaturated environment and the crystal surface:
$$\frac{dM}{dt} = 4 \pi C K_d \left( S_i - 1 \right)$$
where $C$ is the electrostatic capacitance factor of the crystal geometry, $K_d$ is a thermodynamic coefficient combining thermal conductivity and vapor diffusivity, and $S_i = e / e_{s,i}$ is the ice saturation ratio. At temperatures between $-40^\circ\text{C}$ and $-60^\circ\text{C}$, this growth mode heavily favours hexagonal columns, hollow bullet rosettes, and aggregated needles, as documented in the WMO International Cloud Atlas.
3.2. Aerodynamic Terminal Fall Velocity
As crystals grow to dimensions $D \sim 100\text{ to }1000\ \mu\text{m}$, they attain a terminal sedimentation velocity, $v_t$, where downward gravitational force balances upward aerodynamic drag:
$$v_t(D) = \sqrt{\frac{2 m(D) g}{\rho_{\text{air}} A(D) C_d(\text{Re})}}$$
Here, $m(D)$ is crystal mass, $A(D)$ is projected cross-sectional area, $\rho_{\text{air}}$ is ambient air density, and $C_d$ is the drag coefficient governed by the Reynolds number $\text{Re} = v_t D / \nu$. In practical atmospheric modeling, power-law parameterizations derived from empirical observations are utilized:
$$v_t = a D^b \left( \frac{\rho_0}{\rho_{\text{air}}} \right)^{\gamma}$$
For typical bullet rosettes and dense columns in the upper troposphere, terminal fall speeds remain remarkably constrained, typically settling between $0.5\text{ m s}^{-1}$ and $1.2\text{ m s}^{-1}$.
    Trajectory Geometry of an Ice Fallstreak:

    z_head ------------------- [ Generating Head: u_head ]
           |       .
           |         .
           |           .  <-- Fallstreak Curve: x(z)
           |             .
           |               .
       z   ------------------- [ Layer at height z: u(z) ]
           |<---- x(z) ------>|
3.3. The Mathematical Kinematics of the Fallstreak Trajectory
Let the generating head reside at an initial altitude $z_0$ with an ambient horizontal wind vector $u_{\text{head}} = u(z_0)$. As an ice crystal sediments downward with terminal velocity $v_t(z')$, its horizontal position $x(z)$ relative to the generating head at any lower altitude $z$ is governed by the relative horizontal velocity between the falling crystal and the parent head:
$$x(z) = \int_{z}^{z_0} \frac{u(z') - u_{\text{head}}}{v_t(z')} \, dz'$$
To demonstrate how this generates the characteristic parabolic hook, let us assume a uniform vertical wind shear $S_z = \frac{du}{dz} = \text{constant}$, such that the horizontal wind field varies linearly with height:
$$u(z') - u_{\text{head}} = -S_z (z_0 - z')$$
Assuming a representative, vertically averaged terminal velocity $\overline{v}_t$, we evaluate the integral directly:
$$x(z) = \int_{z}^{z_0} \frac{-S_z (z_0 - z')}{\overline{v}t} \, dz' = -\frac{S_z}{\overline{v}_t} \left[ z_0 z' - \frac{(z')^2}{2} \right]{z}^{z_0}$$
Evaluating this definite integral between $z$ and $z_0$:
$$x(z) = -\frac{S_z}{2 \overline{v}_t} (z_0 - z)^2$$
The Parabolic Fallstreak Theorem
In a layer of constant linear vertical wind shear $S_z$, an ice fallstreak with constant sedimentation velocity traces a pure parabola in the vertical plane. The curvature of the streak is directly proportional to the magnitude of the environmental wind shear $S_z$ and inversely proportional to the crystal fall speed $\overline{v}_t$.
3.4. Worked Mathematical Example: Calculating Trajectory and Tilt Angle
Let us calculate the physical trajectory and apparent tilt angle of a classic cirrus uncinus fallstreak observed in the mid-latitudes under the following realistic upper-air parameters:
- Generating head altitude: $z_0 = 10,500\text{ m}$
- Observation base altitude: $z = 9,000\text{ m}$ ($\Delta z = 1,500\text{ m}$)
- Wind at head level: $u_{\text{head}} = 45.0\text{ m s}^{-1}$
- Wind at streak base: $u(z) = 25.0\text{ m s}^{-1}$ ($\Delta u = 20.0\text{ m s}^{-1}$)
- Mean crystal terminal velocity: $\overline{v}_t = 0.80\text{ m s}^{-1}$
Step 1: Calculate the total sedimentation time ($t_{\text{fall}}$): $$t_{\text{fall}} = \frac{\Delta z}{\overline{v}_t} = \frac{1,500\text{ m}}{0.80\text{ m s}^{-1}} = 1,875\text{ seconds } (\approx 31.25\text{ minutes})$$
Step 2: Calculate the horizontal displacement ($\Delta x$): The constant vertical shear is $S_z = \frac{\Delta u}{\Delta z} = \frac{20.0\text{ m s}^{-1}}{1,500\text{ m}} = 0.01333\text{ s}^{-1}$. Substituting into our parabolic equation: $$\Delta x = \frac{S_z}{2 \overline{v}_t} (\Delta z)^2 = \frac{0.01333}{2 \times 0.80} (1,500)^2 = \frac{0.01333}{1.60} \times 2,250,000 \approx 18,745\text{ metres } (\approx 18.75\text{ km})$$
Step 3: Calculate the instantaneous streak tilt angle ($\theta$) at the base: The local tangent angle $\theta$ of the streak relative to the vertical axis is given by the ratio of horizontal velocity differential to vertical fall speed:
$$\theta = \arctan \left( \frac{|u(z) - u_{\text{head}}|}{\overline{v}_t} \right) = \arctan \left( \frac{20.0\text{ m s}^{-1}}{0.80\text{ m s}^{-1}} \right) = \arctan(25.0) \approx 87.7^\circ$$
An observer looking at this streak sees a filament that has sheared over so heavily that its lower tail runs almost perfectly horizontal to the Earth's surface—a visual testament to the twenty-metre-per-second velocity gradient across that 1.5-kilometre atmospheric slab.
3.5. Synoptic Harbingers: Jet Streaks and Warm Conveyor Belts
Why do these clouds appear so reliably before deteriorating weather?
According to the classical Norwegian cyclone model expanded by modern quasi-geostrophic theory (detailed in the American Meteorological Society Glossary of Meteorology), mid-latitude extratropical cyclones are driven by strong baroclinic instability. Ahead of an advancing surface warm front, warm, moist air is forced to ascend along gently sloping isentropic surfaces (surfaces of constant potential temperature, $\theta$).
SYNOPTIC CROSS-SECTION (Warm Front & Conveyor Belt):

Altitude
  ^
  |                                        Cirrus uncinus (8-11 km)
10 km - - - - - - - - - - - - - - - - - - [ Mare's Tails ]
  |                                      . '
  |                            Cirrostratus
  |                          . '
5 km - - - - - - - - - Altostratus - - - - - - - - - - - - - - - - - -
  |                  . '
  |          Nimbostratus (Steady Rain / Snow)
  |        . '
0 km --- Warm Frontal Surface ---------------------------------------->
       [ Cold Air Dome at Surface ]              [ Approaching Warm Sector ]
This ascending airstream is termed the Warm Conveyor Belt (WCB). As the WCB rises from the boundary layer over hundreds of kilometres, it reaches the upper troposphere where it encounters the strong horizontal winds of an upper-level jet streak.
The very leading edge of this system consists of feeble, elevated updrafts in a dry upper troposphere supersaturated only with respect to ice. The generating heads of cirrus uncinus form precisely in this initial, weakly buoyant ascent zone. Because the upper-level jet winds aloft are far stronger than the winds in the mid-troposphere, these newborn ice crystals are instantly sheared into dramatic fallstreaks.
Thus, cirrus uncinus serves as the visible vanguard of warm advection aloft, appearing 24 to 48 hours ahead of the surface warm front, steady nimbostratus precipitation, and cyclonic pressure drops.
4. Practical Outdoor Guidance: Reading the High Sky
You do not need a research radar or an atmospheric sounding balloon to extract quantitative diagnostic information from cirrus uncinus. The sky acts as a natural wind tunnel and diagnostic display if you know how to read the visual and barometric cues.
4.1. What to Look for in the Sky
- Head vs. Tail Orientation: Locate the dense, bright comma-head and track the direction of the trailing plume. If the tail trails behind the head in its direction of travel, the generating head is embedded in higher-velocity winds than the air below. If the tail surges ahead of the head, the wind speed decreases with altitude (negative shear).
- The Transition Sequence: Watch how the sky evolves over a period of 4 to 8 hours:
- Isolated hooks remaining static or dispersing: Indicates transient upper-level moisture patches or minor wave ripples; weather will remain fair.
- Hooks multiplying, thickening, and merging into a milky sheet (cirrostratus): Indicates systematic synoptic-scale isentropic upglide. Expect halo phenomena around the sun or moon, followed by lowering cloud bases (altostratus), sun-obscuration, and steady precipitation within 18 to 36 hours. Consult the Met Office Guide to Cirrus for identification criteria.
4.2. Instrument Signatures to Monitor
To confirm whether the cirrus uncinus overhead marks an incoming cyclone, correlate your sky observations with three primary instruments:
| Instrument | Fair-Weather Cirrus Reading | Approaching Warm Front / Conveyor Belt Reading |
|---|---|---|
| Aneroid Barometer | Steady ($\Delta p < 0.5\text{ hPa} / 3\text{ hr}$) | Falling steadily ($\Delta p > 1.5\text{ to }3.0\text{ hPa} / 3\text{ hr}$) |
| Surface Wind Vane | Variable or steady onshore breeze | Systematically backing (e.g., shifting North $\rightarrow$ East $\rightarrow$ South-East) |
| Hygrometer | Surface relative humidity flat | Surface humidity gradually climbing as virga aloft begins pre-saturating the column |
4.3. The Navigator’s and Hiker’s Practical Rule
To determine the location of the approaching low-pressure centre without a digital forecast, combine cirrus uncinus tracking with Buys Ballot’s Law:
- Stand with your back directly to the surface wind.
- Note the direction from which the high-altitude cirrus uncinus heads are advancing.
- In the Northern Hemisphere, the core of the low-pressure storm system lies roughly $90^\circ$ to your left (or in the direction toward which the high hooks are pointing as they thicken). If the clouds advance from the west-southwest while your surface wind blows from the east-southeast, a warm front is actively overriding the cold dome above you.
For further exploration of synoptic cloud systems, the Royal Meteorological Society Weather Guide provides extensive observational frameworks.
5. Today's Meteorological Rule of Thumb
"Hooks in the morning blue, wind and rain are overdue; when mare's tails cross the sun, twenty hours till the rivers run."
Whenever delicate cirrus hooks multiply and thicken across the sky while your barometer begins a steady fall, you are witnessing the leading edge of a warm conveyor belt—expect lowering ceilings, a backing wind, and widespread precipitation within 24 to 48 hours.