Lscpu: Inspecting CPU Microarchitectures, Auditing Hardware Vulnerability Mitigations, and Profiling NUMA Topologies in Production
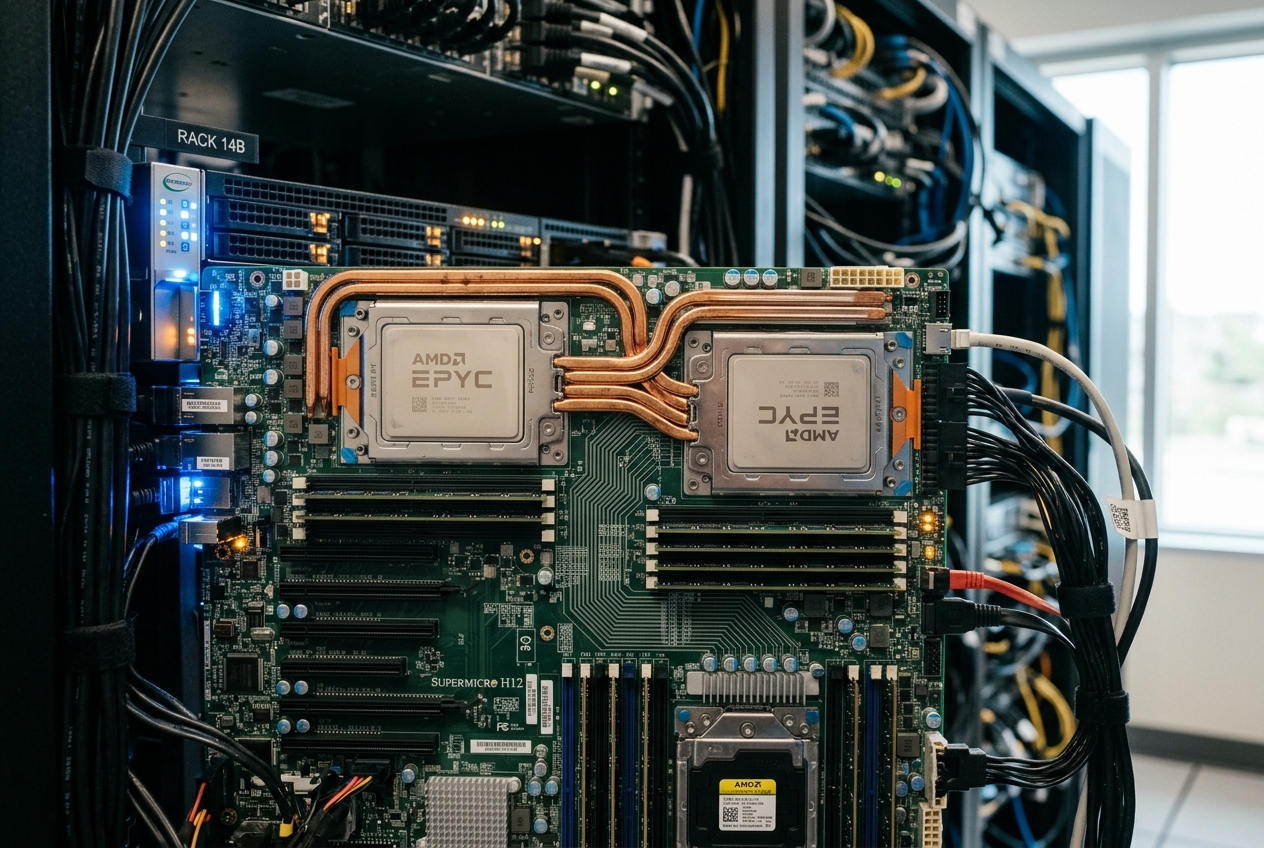
To the untrained eye, the machine appears half-asleep. But seasoned systems administrators know that high-level percentage charts often mask the messier physical reality of modern computing. When a workload degrades without saturating the processor, the bottleneck is rarely raw compute power; it is almost always architectural friction. Application threads may be thrashing across distant memory controllers, cores might be stalling on cache misses, or security barriers may be quietly throttling speculative execution. Before reaching for complex kernel tracing tools or dynamic profilers, you need an instant, authoritative x-ray of the physical silicon. That diagnostic journey begins with a single command: lscpu.
At its core, lscpu translates the cryptic maze of modern processor silicon into a clear, actionable blueprint. Rather than leaving you to guess what an opaque chip model number really means, it maps the complete physical hierarchy of your server: physical sockets, memory domains, hardware cores, multithreaded siblings, and high-speed memory caches. It explains what hardware features your processor supports, whether speculative execution security patches are active, and how operating system threads map to physical silicon—all without interrupting running services or requiring external hardware probes.
The fastest way to orient yourself on any unfamiliar Linux machine is to run lscpu without arguments to generate an instant baseline summary:
lscpu
Architecture:                    x86_64
CPU op-mode(s):                  32-bit, 64-bit
Address sizes:                   46 bits physical, 48 bits virtual
Byte Order:                      Little Endian
CPU(s):                          64
On-line CPU(s) list:             0-63
Vendor ID:                       GenuineIntel
Model name:                      Intel(R) Xeon(R) Gold 6338 CPU @ 2.00GHz
CPU family:                      6
Model:                           106
Thread(s) per core:              2
Core(s) per socket:              32
Socket(s):                       1
Stepping:                        6
CPU(s) scaling MHz:              24%
CPU max MHz:                     3200.0000
CPU min MHz:                     800.0000
BogoMIPS:                        4000.00
Flags:                           fpu vme de pse tsc msr pae mce cx8 apic sep mtrr pge mca cmov pat pse36 clflush dts acpi mmx fxsr sse sse2 ss ht tm pbe syscall nx pdpe1gb rdtscp lm constant_tsc art arch_perfmon pebs bts rep_good nopl xtopology nonstop_tsc cpuid aperfmperf pni pclmulqdq dtes64 monitor ds_cpl vmx smx est tm2 ssse3 sdbg fma cx16 xtpr pdcm pcid dca sse4_1 sse4_2 x2apic movbe popcnt tsc_deadline_timer aes xsave avx f16c rdrand lahf_lm abm 3dnowprefetch cpuid_fault epb cat_l3 cdp_l3 invpcid_single intel_ppin ssbd mba ibrs ibpb stibp ibrs_enhanced fsgsbase tsc_adjust bmi1 avx2 smep bmi2 erms invpcid cqm rdt_a avx512f avx512dq rdseed adx smap avx512ifma clflushopt clwb intel_pt avx512cd sha_ni avx512bw avx512vl xsaveopt xsavec xgetbv1 xsaves cqm_llc cqm_occup_llc cqm_mbm_total cqm_mbm_local split_lock_detect wbnoinvd dtherm ida arat pln pts avx512vbmi umip pku ospke avx512_vbmi2 gfni vaes vpclmulqdq avx512_vnni avx512_bitalg tme avx512_vpopcntdq la57 rdpid fsrm md_clear pconfig flush_l1d arch_capabilities
Virtualization features:
  Virtualization:                VT-x
Caches (sum of all):
  L1d:                           1.5 MiB (32 instances)
  L1i:                           1 MiB (32 instances)
  L2:                            40 MiB (32 instances)
  L3:                            48 MiB (1 instance)
NUMA:
  NUMA node(s):                  1
  NUMA node0 CPU(s):             0-63
Vulnerabilities:
  Gather data sampling:          Not affected
  Itlb multihit:                 Not affected
  L1tf:                          Not affected
  Mds:                           Not affected
  Meltdown:                      Not affected
  Mmio stale data:               Mitigation; Clear CPU buffers; SMT vulnerable
  Retbleed:                      Not affected
  Spec rsb overflow:             Not affected
  Spec store bypass:             Mitigation; Speculative Store Bypass disabled via prctl
  Spectre v1:                    Mitigation; usercopy/swapgs barriers and __user pointer sanitization
  Spectre v2:                    Mitigation; Enhanced / Automatic IBRS; IBPB "conditional"; RSB filling; PBRSB-eIBRS "SW sequence"; BHI "Syscall hardening, KVM: SW loop"
  Srbds:                         Not affected
  Tsx async abort:               Not affected
In less than a second, this snapshot reveals the machine's anatomy. We are looking at a single-socket Intel Ice Lake processor with 32 physical cores, doubled via simultaneous multithreading (SMT) into 64 logical execution threads, backed by 48 megabytes of shared Level-3 cache, and governed by active silicon-level speculation defences.
Under the Hood: Telemetry Ingestion and Core Flags
To appreciate the diagnostic reach of lscpu, one must understand how it gathers data from kernel interfaces and hardware registers. Maintained within the authoritative util-linux suite, the utility unifies three distinct architectural telemetry channels:
(/sys/devices/system/cpu/ & /sys/devices/system/node/)"] Engine --> CPUID["Direct CPUID Execution
(EAX, EBX, ECX, EDX Register Probing)"] Engine --> ACPI["ACPI / DMI Discovery
(SRAT/SLIT Tables & SMBIOS Firmware Data)"]
- Virtual Filesystem Traversal (
sysfs): The command queries/sys/devices/system/cpu/to determine the online, offline, and present state of every logical thread. It parses/sys/devices/system/cpu/cpuX/topology/to resolve core, socket, and cluster IDs, reads/sys/devices/system/cpu/cpuX/cache/to map cache sharing geometries, and inspects/sys/devices/system/node/to reconstruct memory affinities as documented in the Linux Kernel CPU Topology Documentation. - Direct Instruction Execution (
CPUID): On x86 and x86-64 architectures, the utility executes theCPUIDassembly instruction across accessible execution threads. By populating theEAXregister with function leaves and reading the resulting values acrossEAX,EBX,ECX, andEDX, it directly discovers processor family metadata, microcode revision levels, and hardware capability flags (such as AVX-512, AMX, and VMX) as detailed in the Intel 64 and IA-32 Architectures Software Developer Manual. - Firmware and ACPI Interrogation: It evaluates Advanced Configuration and Power Interface (ACPI) tables—specifically the System Resource Affinity Table (SRAT) and System Locality Information Table (SLIT)—alongside Desktop Management Interface (DMI) structures exposed through kernel memory to evaluate memory distances, physical socket arrangements, and chassis power boundaries.
Core Flags Reference
| Flag | Purpose | Operational Context |
|---|---|---|
lscpu |
Standard summary view | Instant baseline inspection of model, cores, sockets, and flags. |
-e, --extended[=LIST] |
Columnar topology matrix | Precise mapping of logical CPUs to cores, sockets, nodes, and caches. |
-C, --caches[=LIST] |
Structured cache hierarchy | Granular analysis of L1i, L1d, L2, and L3 sizing, ways, and allocation sets. |
-J, --json |
Structured JSON output | Automated host capability ingestion within CI/CD and orchestration pipelines. |
--vulnerabilities |
Hardware vulnerability audit | Comprehensive inspection of speculative execution mitigations across cores. |
-p, --parse[=LIST] |
Comma-delimited parse mode | Script-friendly exports optimized for direct ingestion by awk and cut. |
-a, --all |
Include offline CPUs | Essential for diagnosing hotplug states and virtual CPU allocation caps. |
-y, --physical |
Physical allocation display | Distinguishes physical core boundaries from logical hyperthreaded siblings. |
Five Real-World Production Use Cases
1. Fleet-Wide Hardware Vulnerability Mitigation Auditing
Scenario
Following an automated enterprise kernel upgrade across thousands of bare-metal database hypervisors, security compliance alerts report that speculative execution side-channel mitigations may have regressed or introduced severe translation lookaside buffer (TLB) flushing overheads. The engineering team must verify whether hardware mitigations (such as eIBRS and KPTI) are active, whether hyperthreading exposes the system to cross-thread data leakage, and whether down-level microcode leaves processors exposed to Downfall (Gather Data Sampling) or Retbleed vulnerabilities.
Command
lscpu --vulnerabilities
Annotated Terminal Output
Vulnerability            Mitigation
Gather data sampling:    Mitigation; Microcode; Vulnerable: GDS: SMT enabled, No microcode
Itlb multihit:           KVM: Mitigation: VMX disabled
L1tf:                    Not affected
Mds:                     Mitigation; Clear CPU buffers; SMT vulnerable
Meltdown:                Not affected
Mmio stale data:         Mitigation; Clear CPU buffers; SMT vulnerable
Retbleed:                Mitigation; Enhanced IBRS
Spec rsb overflow:       Not affected
Spec store bypass:       Mitigation; Speculative Store Bypass disabled via prctl and seccomp
Spectre v1:              Mitigation; usercopy/swapgs barriers and __user pointer sanitization
Spectre v2:              Mitigation; Enhanced / Automatic IBRS; IBPB conditional; RSB filling; PBRSB-eIBRS SW sequence; BHI Syscall hardening, KVM SW loop
Srbds:                   Not affected
Tsx async abort:         Not affected
Analytical Breakdown
Gather data sampling: Indicates the CPU is susceptible to Downfall (GDS) attacks, where vector register contents leak across speculative gather instructions. The status showsVulnerable: GDS: SMT enabled, No microcode, signalling that the system's firmware lacks the required Intel microcode patch.Mds/Mmio stale data: ReportsMitigation; Clear CPU buffers; SMT vulnerable. The kernel clears microarchitectural fill buffers upon context transitions via themd_clearinstruction, but the presence of hyperthreading (SMT vulnerable) means sibling threads on the same physical core could theoretically intercept transient execution traces.Meltdown/L1tf: ReportsNot affected, verifying that the physical processor contains in-silicon hardware fixes preventing unprivileged access to kernel address spaces and Level-1 data cache probing.Spectre v2: Confirms that hardware-level Enhanced IBRS (Enhanced / Automatic IBRS) is engaged alongside Indirect Branch Prediction Barriers (IBPB conditional), avoiding the severe performance degradation associated with pure software retpoline sequences as detailed in the Linux Kernel Hardware Vulnerabilities Guide.
Next Steps for the Administrator
- Update the host microcode package immediately via the system package manager (
intel-microcodeoramd64-microcode) and trigger an early initramfs microcode reload to neutralise the Gather Data Sampling vulnerability. - If strict isolation between untrusted multi-tenant containers is required, disable Simultaneous Multithreading by writing
offto/sys/devices/system/cpu/smt/controlor passingnosmtas a kernel boot parameter in the GRUB configuration. - For latency-critical internal workloads where performance overrides cross-process speculation threats, selectively relax mitigations via kernel boot parameters such as
mitigations=offor specific mitigation flags (e.g.mds=off), documenting the operational security trade-off.
2. NUMA Topology Decomposition for Precise CPU Thread and Memory Affinity
Scenario
A distributed in-memory data store (such as Redis Enterprise or an ultra-low-latency financial matching engine) is deployed across a dual-socket, 128-thread server. Throughput benchmarks reveal unpredictable latency spikes and high interconnect bus traffic. Threads executing on Socket 1 are frequently accessing memory allocated from memory controllers physically wired to Socket 0. The engineer must obtain an exact topological mapping of logical CPUs, their physical core allocations, socket assignments, NUMA domains, and cache associations to construct deterministic thread affinity masks.
Command
lscpu -e=CPU,CORE,SOCKET,NODE,L1D,L2,L3
Annotated Terminal Output
CPU CORE SOCKET NODE L1D:L1I:L2:L3
  0    0      0    0 0:0:0:0
  1    1      0    0 1:1:1:0
  2    2      0    0 2:2:2:0
  3    3      0    0 3:3:3:0
...
 31   31      0    0 31:31:31:0
 32    0      0    0 0:0:0:0
 33    1      0    0 1:1:1:0
...
 63   31      0    0 31:31:31:0
 64   32      1    1 32:32:32:1
 65   33      1    1 33:33:33:1
...
 95   63      1    1 63:63:63:1
 96   32      1    1 32:32:32:1
 97   33      1    1 33:33:33:1
...
127   63      1    1 63:63:63:1
Analytical Breakdown
CPU 0andCPU 32: ShareCORE 0,SOCKET 0,NODE 0, and the exact cache instances0:0:0:0(L1d:0, L1i:0, L2:0, L3:0). This demonstrates that logical CPU 0 and CPU 32 are SMT hyperthread siblings sharing execution units and Level-1/2 private caches.SOCKET 0vsSOCKET 1Boundaries: Sockets map directly toNODE 0(CPUs 0–63) andNODE 1(CPUs 64–127). The Level-3 cache instance switches from0to1starting at CPU 64.- NUMA Coherence Boundary: Memory accessed by threads scheduled on CPUs 64–127 that resides on Node 0 must traverse the inter-socket interconnect, incurring a 30–50% memory latency penalty as documented in Kernel Documentation on NUMA Memory Locality and Performance.
(CPU 0, 32)
L1/L2 Cache"] C31["Core 31
(CPU 31, 63)
L1/L2 Cache"] L3_0["Unified L3 Cache (Instance 0)"] C0 --> L3_0 C31 --> L3_0 end subgraph Node1["Socket 1 (NUMA Node 1)"] direction TB C32["Core 32
(CPU 64, 96)
L1/L2 Cache"] C63["Core 63
(CPU 95, 127)
L1/L2 Cache"] L3_1["Unified L3 Cache (Instance 1)"] C32 --> L3_1 C63 --> L3_1 end L3_0 <-->|"UPI / Infinity Fabric
(Cross-Socket Interconnect)"| L3_1
Next Steps for the Administrator
- Enforce strict NUMA process containment using
numactlto pin the application's primary processing threads and memory allocations to Node 0:bash numactl --cpunodebind=0 --membind=0 /usr/bin/matching-engine --config /etc/engine.conf - Isolate SMT siblings for deterministic real-time processing. Pin the primary polling loop to
CPU 0and ensure siblingCPU 32is shielded from other kernel tasks usingtasksetor systemd CPU isolation directives:bash taskset -c 0,1,2,3 /usr/bin/critical-worker - Update container runtime manifests (such as Kubernetes
KubeletConfiguration) to utilise thestaticCPU Manager policy withTopologyManagerPolicy=single-numa-nodeto prevent container threads from spanning NUMA boundaries.
3. Automated Hardware Capability Validation in CI/CD Deployments
Scenario
A machine learning deployment pipeline distributes containerised deep neural network inference models and cryptography microservices across heterogeneous cloud and bare-metal servers. The inference binaries are compiled with strict vectorisation requirements (Intel AVX-512 VNNI for integer matrix multiplication and AES-NI for high-speed encryption). Deploying these containers onto older hypervisors lacking these instructions results in immediate SIGILL (Illegal Instruction) crashes. The automated deployment pipeline must verify hardware support before provisioning the application layer.
Command
lscpu --json
Annotated Terminal Output
{
   "lscpu": [
      {"field": "Architecture:", "data": "x86_64"},
      {"field": "CPU op-mode(s):", "data": "32-bit, 64-bit"},
      {"field": "Address sizes:", "data": "48 bits physical, 48 bits virtual"},
      {"field": "Byte Order:", "data": "Little Endian"},
      {"field": "CPU(s):", "data": "16"},
      {"field": "On-line CPU(s) list:", "data": "0-15"},
      {"field": "Vendor ID:", "data": "GenuineIntel"},
      {"field": "Model name:", "data": "Intel(R) Xeon(R) Platinum 8370C CPU @ 2.80GHz"},
      {"field": "CPU family:", "data": "6"},
      {"field": "Model:", "data": "106"},
      {"field": "Thread(s) per core:", "data": "2"},
      {"field": "Core(s) per socket:", "data": "8"},
      {"field": "Socket(s):", "data": "1"},
      {"field": "Virtualization:", "data": "VT-x"},
      {"field": "Flags:", "data": "fpu vme de pse tsc msr pae mce cx8 apic sep mtrr pge mca cmov pat pse36 clflush mmx fxsr sse sse2 ss ht syscall nx pdpe1gb rdtscp lm constant_tsc rep_good nopl cpuid tsc_known_freq pni pclmulqdq vmx ssse3 fma cx16 pcid sse4_1 sse4_2 x2apic movbe popcnt tsc_deadline_timer aes xsave avx f16c rdrand hypervisor lahf_lm abm 3dnowprefetch cpuid_fault ssbd ibrs ibpb stibp ibrs_enhanced tpr_shadow vnmi ept vpid ept_ad fsgsbase tsc_adjust bmi1 avx2 smep bmi2 erms invpcid avx512f avx512dq rdseed adx smap avx512ifma clflushopt clwb avx512cd sha_ni avx512bw avx512vl xsaveopt xsavec xgetbv1 xsaves avx512_vnni vaes vpclmulqdq avx512_vbmi2 gfni avx512_vpopcntdq rdpid fsrm md_clear flush_l1d arch_capabilities"}
   ]
}
Analytical Breakdown
Structured JSON Schema: The--jsonflag formats all telemetry into a standardised key-value array under the rootlscpunode, eliminating the need for fragile text parsing against regular expressions.Flags Field Extraction: TheFlags:string includes:avx512f,avx512dq,avx512bw,avx512vl: Confirms base AVX-512 instruction set support alongside doubleword, quadword, byte, and vector length extensions.avx512_vnni: Confirms Vector Neural Network Instructions support for accelerated INT8/INT16 convolutional inference operations.aesandvaes: Validates single-block and Vector AES acceleration.vmx/hypervisor: Identifies virtualization capabilities and confirms execution within a guest virtual machine.
Next Steps for the Administrator
Integrate the telemetry validation directly into the deployment provisioning script using jq:
#!/usr/bin/env bash
set -euo pipefail

CPU_METRICS=$(lscpu --json)

# Assert mandatory microarchitectural extensions
check_cpu_flag() {
    local flag="$1"
    echo "$CPU_METRICS" | jq -e --arg FLAG "$flag" \
        '.lscpu[] | select(.field == "Flags:") | .data | split(" ") | contains([$FLAG])' > /dev/null
}

echo "Validating host compute capabilities..."
for required_flag in "avx512f" "avx512_vnni" "aes"; do
    if check_cpu_flag "$required_flag"; then
        echo "[PASSED] Hardware capability: $required_flag present."
    else
        echo "[FAILED] Critical CPU extension '$required_flag' missing on host $(hostname)." >&2
        exit 1
    fi
done

echo "Hardware certified. Proceeding with high-performance payload deployment."
4. Multi-Level Cache Hierarchy Profiling to Diagnose Cache Thrashing
Scenario
A high-concurrency event processing gateway written in C++ exhibits severe execution stalls. Profiling with hardware performance counters reveals millions of Last Level Cache (LLC) misses per second and intense bus locking overhead. The engineering team suspects false sharing and cache-line invalidation storms across cores sharing Level-2 and Level-3 structures. The performance engineer must extract precise cache capacities, associativity (ways), line sizes, and core-sharing arrangements to optimize data structure alignment and thread grouping.
Command
lscpu -C
Annotated Terminal Output
NAME ONE-SIZE ALL-SIZE WAYS TYPE        LEVEL SETS PHY-LINE COHERENCY-SIZE
L1d       48K     1.5M   12 Data            1   64        1             64
L1i       32K       1M    8 Instruction     1   64        1             64
L2       1.3M      40M   20 Unified         2 1024        1             64
L3        48M      48M   12 Unified         3 65536       1             64
Analytical Breakdown
COHERENCY-SIZE (64 Bytes): Identifies the fundamental unit of cache transfer across all levels. Any concurrent write operations performed by separate threads to distinct variables residing within the same 64-byte boundary will trigger cache coherency protocols, invalidating the entire line across sibling caches and creating severe performance degradation (false sharing).WAYS (Associativity):L1dis 12-way set associative (48K / (64 * 12) = 64 sets).L2is 20-way set associative (1.25M / (64 * 20) = 1024 sets).L3is 12-way set associative across 65,536 sets.ONE-SIZE vs ALL-SIZE:L1dis 48 KiB per physical core, totalling 1.5 MiB across the 32 physical cores.L2is 1.25 MiB private to each physical core (totalling 40 MiB).L3is a single 48 MiB shared pool (ONE-SIZE = 48M,ALL-SIZE = 48M), serving all 32 cores on the silicon die.
Next Steps for the Administrator
- Align concurrent data structures in application code to 64-byte cache-line boundaries using language primitives (such as C++
alignas(64)) to eliminate false sharing across threads:cpp struct alignas(64) WorkerState { std::atomic<uint64_t> sequence_number; char padding[56]; // Explicitly prevent false sharing with adjacent instances }; - Schedule worker threads that operate on shared memory regions to run on logical cores that share an L2 or L3 cache domain, minimising inter-core interconnect latency.
- Configure Linux Huge Pages via the Transparent Hugepage Interface to reduce TLB thrashing across the 65,536 Level-3 cache sets:
bash
   echo always > /sys/kernel/mm/transparent_hugepage/enabled
5. Dynamic Frequency Scaling and Core State Telemetry Under Thermal Load
Scenario
A cluster of compute nodes executing batch matrix transformations experiences unpredictable completion times. Several nodes exhibit a 40% reduction in processing throughput despite identical software versions, input sizes, and ambient data center rack positions. The systems engineer suspects that nodes are either trapped in conservative power-saving scaling governors, suffering from CPU frequency throttling under vector instruction load (AVX frequency offset), or experiencing hardware thermal throttling that forces cores into lower frequency states.
Command
lscpu --extended=CPU,MAXMHZ,MINMHZ,CURRENTMHZ,ONLINE
Annotated Terminal Output
CPU MAXMHZ    MINMHZ   CURRENTMHZ ONLINE
  0 3600.0000 800.0000  3498.1250    yes
  1 3600.0000 800.0000  3498.1250    yes
  2 3600.0000 800.0000  1199.3420    yes
  3 3600.0000 800.0000  1200.0110    yes
  4 3600.0000 800.0000   800.0000    yes
...
 28 3600.0000 800.0000  3599.8900    yes
 29 3600.0000 800.0000  3600.0000    yes
 30 3600.0000 800.0000   800.0000    yes
 31 3600.0000 800.0000   800.0000    yes
Analytical Breakdown
MAXMHZ/MINMHZ: Defines the hardware operational dynamic range (800 MHz baseline frequency up to a 3.6 GHz Turbo Boost envelope).CURRENTMHZ Divergence:CPU 0andCPU 1are operating at ~3.5 GHz under load.CPU 2andCPU 3are throttled down to ~1.2 GHz.CPU 4,CPU 30, andCPU 31are pinned at the absolute minimum frequency floor of 800 MHz.- Operational Implication: The cores are experiencing severe non-uniform frequency scaling. This indicates that the
powersavegovernor is failing to ramp frequencies quickly enough, or that the processor package is undergoing thermal throttling or power budget capping (RAPL limit) due to sustained workload draw.
Next Steps for the Administrator
- Inspect the active CPU frequency scaling governors across all online cores using the sysfs interface or tools outlined in ArchWiki CPU Frequency Scaling:
bash cat /sys/devices/system/cpu/cpu*/cpufreq/scaling_governor | sort | uniq -c - Switch all cores globally to the deterministic
performancegovernor to lock cores to peak operational frequencies and eliminate ramp-up latency:bash cpupower frequency-set -g performance - Check kernel thermal logging interfaces for active thermal throttling events:
bash dmesg -T | grep -iE "thermal|throttled|cpu clock throttled" - Adjust the Energy Performance Bias (EPB) from energy-saving to maximum compute performance:
bash
   x86_energy_perf_policy performance
What Can Go Wrong: Edge Cases, Virtualization Distortions, and Pitfalls
1. Virtualisation Topology Masking and Hypervisor Synthetic Layouts
When executing lscpu inside virtual machines (KVM, Xen, VMware ESXi, or AWS EC2 Nitro instances), the output does not necessarily reflect the true underlying physical silicon. Hypervisors often present synthetic, flat CPU topologies:
* NUMA Obfuscation: By default, a hypervisor may present 16 virtual CPUs as a single flat NUMA node, even if the underlying physical host spans two physical sockets. Applications relying on lscpu to determine thread binding may inadvertently schedule heavy cross-socket communication.
* Cache Topology Hallucination: Some virtualisation layers do not pass through exact Level-3 cache sharing structures, showing each vCPU with an isolated virtual cache, or omitting cache sizing entirely.
* Remediation: In virtualised environments, always cross-reference lscpu with hypervisor-aware interfaces or ensure NUMA pass-through (such as numa=virt in QEMU/KVM XML configurations) is explicitly provisioned.
2. Fragile Text Scraping in Shell Scripts
A frequent pitfall in automation scripts is scraping the default text output of lscpu using grep, awk, or sed:
# FRAGILE AND DISCOURAGED PATTERN:
SOCKETS=$(lscpu | grep "Socket(s):" | awk '{print $2}')
- Failure Mode: The human-readable string formats change across
util-linuxversions. Field names, colon placement, and indentation differ across distribution releases. Furthermore, system localisation settings (LANG/LC_ALL) will translate labels, breaking string matches entirely. - Defensive Practice: Always enforce machine-readable, unlocalised interfaces. Use
lscpu -J(JSON) combined withjq, or uselscpu -p(parseable) with explicit column selection:
# ROBUST, PRODUCTION-GRADE EXTRACTION:
SOCKETS=$(lscpu -J | jq -r '.lscpu[] | select(.field == "Socket(s):") | .data')
# OR VIA COLUMNAR PARSE MODE:
ONLINE_CORES=$(lscpu -p=CPU,ONLINE | grep -v '^#' | grep ',yes' | wc -l)
3. CPU Hotplugging and Offline Core Blind Spots
Standard invocations of lscpu report primarily on active, online execution contexts. On virtualised cloud instances with dynamic CPU hotplugging or systems where cores have been manually offlined to conserve thermal envelopes, relying purely on the summary header can misrepresent total system capacity:
* Failure Mode: Assuming CPU(s): 32 implies 32 online compute engines, missing the fact that On-line CPU(s) list: 0-15 indicates half the compute capacity is offline.
* Remediation: Always cross-reference the Off-line CPU(s) list field or execute lscpu -a -e to inspect the explicit ONLINE state of every physical and logical ID.
Today's Takeaway
The modern microprocessor is no longer a simple sequential instruction engine; it is a distributed parallel computer in miniature, complete with complex cache hierarchies, multi-node memory buses, dynamic frequency regulators, and silicon security barriers. In the next five minutes, open a terminal on your primary Linux system and run lscpu -e=CPU,CORE,SOCKET,NODE,L1D,L2,L3 alongside lscpu --vulnerabilities. In doing so, you will shift your operational perspective from viewing the CPU as an abstract compute percentage to understanding the precise physical layout of your silicon—a foundational skill for unmasking hidden performance bottlenecks, eliminating memory contention, and building resilient systems.