Iftop: Auditing Real-Time Interface Bandwidth, Isolating Host-to-Host Traffic Saturation, and Triaging Cloud Egress Spikes in Production
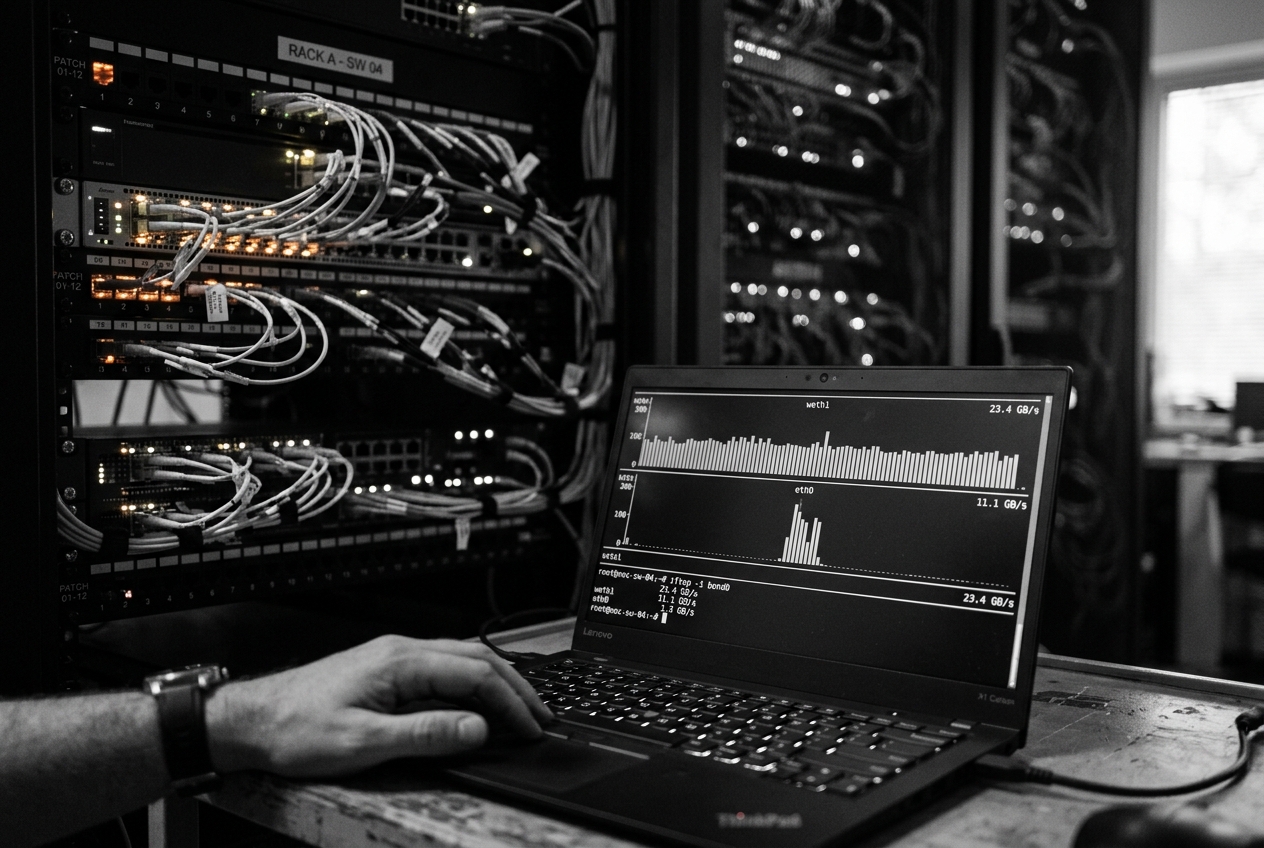
You establish an emergency SSH session into the primary gateway to investigate. The usual suspects reveal nothing amiss: CPU utilisation is idling comfortably below thirty percent, system memory has gigabytes to spare, and the storage drives are barely whispering. Yet the physical network interface is rigidly pegged against its hardware ceiling, silently dropping packets by the millions. The server is healthy, but the network pipe is drowning.
In the middle of an operational outage, you do not have the luxury of waiting for aggregate cloud billing dashboards or wading through millions of lines of unstructured logs. You need an immediate, granular, wire-level view of exactly who is flooding the pipe. You need iftop.
The single most reliable, low-overhead diagnostic command to run the moment you log in is:
sudo iftop -n -N -P -i eth0
By stripping away slow DNS lookups (-n), skipping service port translations (-N), and isolating discrete application ports (-P) on your primary interface (-i eth0), this single command delivers an immediate, live scoreboard of active conversations across your network card:
interface: eth0
IP address is: 10.0.8.24
MAC address is: 52:54:00:12:34:56
# host:port                    => / <=            2s       10s       40s  cumulative
------------------------------------------------------------------------------------
1 10.0.8.24:443                => 198.51.100.18:51244  342Mb     310Mb     285Mb     3.42GB
                               <= 198.51.100.18:51244  4.21Mb    3.90Mb    3.55Mb    42.1MB
2 10.0.8.24:5432               => 10.0.12.88:41022     18.4Mb    17.9Mb    18.1Mb     220MB
                               <= 10.0.12.88:41022     82.1Mb    80.4Mb    79.5Mb     980MB
3 10.0.8.24:9100               => 10.0.2.10:58190      124Kb     118Kb     115Kb     1.42MB
                               <= 10.0.2.10:58190      8.20Kb    7.90Kb    8.10Kb     102KB
------------------------------------------------------------------------------------
Total send rate:                                       360Mb     328Mb     303Mb
Total receive rate:                                    86.3Mb    84.3Mb    83.1Mb
Total combined rate:                                   446Mb     412Mb     386Mb
------------------------------------------------------------------------------------
Within two seconds, the mystery is solved: the first line reveals an outbound HTTPS transfer (10.0.8.24:443 => 198.51.100.18:51244) saturating the link at over 340 Mbps, starving the rest of your infrastructure.
1. What It Does in Plain English
Just as the standard top command provides an interactive window into running processes and CPU usage, iftop provides a real-time visual breakdown of network bandwidth.
Rather than showing a single overall number for the interface, iftop inspects network packets directly on the wire. It pairs incoming and outgoing traffic into host-to-host conversations, calculates running bandwidth averages, and displays an ordered, live leaderboard of which connections are consuming your bandwidth.
2. Core Mechanics, Architecture, and Display Geometry
To get the most out of iftop in high-throughput environments, it helps to understand how it ingests packets, smooths out bursty network measurements, and organizes its terminal interface.
Packet Ingestion and Flow Tracking Mechanics
iftop does not poll /proc/net/dev or query Linux interface counters. Instead, it captures raw network frames directly using libpcap via a raw packet socket (PF_PACKET, SOCK_RAW).
When traffic crosses the network interface, libpcap copies packet headers from the Linux kernel into user space. If you supply a packet filter expression, the kernel compiles it into Berkeley Packet Filter (BPF) bytecode via SO_ATTACH_FILTER, discarding non-matching frames inside the kernel before user space ever touches them.
Once ingested, iftop processes the headers through three steps:
1. Flow Key Extraction: It reads the standard 5-tuple: Source IP, Destination IP, Protocol, Source Port, and Destination Port.
2. Bidirectional Aggregation: Rather than splitting a conversation into separate unrelated rows, iftop matches both directions of a connection into a single conversational pair. It tracks transmitted bytes ($H_A \to H_B$) and received bytes ($H_B \to H_A$) inside a stateful hash table.
3. Payload Volume Measurement: It inspects Layer 3 packet length fields (Total Length in IPv4 or Payload Length in IPv6) to record genuine wire throughput.
The Mathematics of Moving Bandwidth Averages
Raw network traffic is naturally spiky—TCP window adjustments, brief packet bursts, and acknowledgment trains cause wild swings from millisecond to millisecond. To provide a stable, human-readable display, iftop calculates an Exponential Moving Average (EMA) across three rolling time windows: 2 seconds, 10 seconds, and 40 seconds.
For any discrete time step $t$ with update interval $\Delta t$, the exponential moving average is calculated as:
$$EMA_t = \alpha \cdot R_t + (1 - \alpha) \cdot EMA_{t-1}$$
Where $R_t$ is the instantaneous data rate and the smoothing factor $\alpha$ is derived from the target window constant $\tau \in {2, 10, 40}$:
$$\alpha = 1 - e^{-\frac{\Delta t}{\tau}}$$
- The 2-second window ($\tau = 2\text{s}$) gives near-instant feedback, alerting you immediately to sudden bursts or confirming when a rogue connection has been killed.
- The 10-second window ($\tau = 10\text{s}$) filters out short spikes to show your medium-term operational baseline.
- The 40-second window ($\tau = 40\text{s}$) highlights sustained, long-lived transfers that steadily monopolise link capacity over time.
Reading the Display Geometry
The interactive ncurses display arranges data in a clear, consistent structure:
| Display Component | Visual Indicator | Purpose |
|---|---|---|
| Scale Bar (Top Ruler) | 100Mb ... 500Mb |
Represents the bandwidth ceiling. Can be dynamic or fixed with -m. |
| Outbound Flow | Host A => Host B |
Data transmitted from local source to remote destination. |
| Inbound Flow | <= Host B |
Data received back from the remote host. |
| Rate Columns | 2s 10s 40s |
Exponential moving averages over the three evaluation windows. |
| Cumulative Column | cum |
Total data volume transferred over the lifetime of the session. |
| Summary Footer | TX / RX / TOTAL |
Combined transmit, receive, peak, and aggregate throughput rates. |
By default, iftop tries to resolve IP addresses into hostnames via reverse DNS queries. During an active bandwidth saturation event, thousands of DNS queries can back up, stalling the interface. Passing -n (disable DNS resolution) and -N (disable port translation) avoids this pitfall entirely.
3. Essential Command-Line Flags
Here are the most important command-line options for production triage:
| Flag | Argument | Purpose | Production Best Practice |
|---|---|---|---|
-i |
<interface> |
Binds capture directly to a specific physical, virtual, or bridge device. | Always explicitly specify the interface (e.g. -i eth0, -i bond0). |
-n |
None | Disables DNS hostname resolution, printing raw IP addresses. | Mandatory during saturation triage to prevent DNS lookup stalls. |
-N |
None | Disables port name resolution (prints port 443 instead of https). |
Essential for identifying custom or non-standard service ports. |
-P |
None | Displays port numbers alongside hostnames (host:port). |
Required to isolate specific application sockets and processes. |
-m |
<limit> |
Sets a fixed ceiling for the top graphical scale bar (e.g. 1G, 10G). |
Set to your physical interface limit to keep visual bars in perspective. |
-F |
<cidr> |
Restricts monitoring to traffic crossing a specific subnet. | Ideal for isolating cross-VPC or external egress traffic. |
-f |
<bpf_expr> |
Applies a custom BPF filter directly inside the kernel packet engine. | Drastically reduces CPU overhead under heavy packet volumes. |
-t |
None | Enables text-only mode, writing clean ASCII output to stdout. | Required for headless SSH sessions, incident scripts, and cron jobs. |
4. Five Real-World Production Use Cases
Use Case 1: Rapid Triage During Acute Bandwidth Saturation
The Scenario
A primary API gateway on a 10Gbps bonded link (bond0) is dropping client connections. High-level graphs show outbound traffic saturating at 9.8 Gbps, but cannot isolate which service or destination is responsible.
The Command
sudo iftop -n -N -i bond0 -m 10G
Terminal Output
1.00Gb            2.50Gb            5.00Gb            7.50Gb            10.0Gb
------------------------------------------------------------------------------
10.240.0.12       => 203.0.113.89        8.42Gb    8.15Gb    7.80Gb     84.2GB
                  <=                     12.1Mb    11.8Mb    11.2Mb      120MB
10.240.0.12       => 10.240.4.52          180Mb     175Mb     160Mb     1.80GB
                  <=                      450Mb     440Mb     420Mb     4.50GB
10.240.0.12       => 172.16.100.4          12Mb      14Mb      15Mb      150MB
                  <=                      1.2Mb     1.1Mb     1.0Mb       12MB
------------------------------------------------------------------------------
TX:             cumm:   86.2GB      peak:   8.90Gb      rates:   8.61Gb   8.34Gb   7.97Gb
RX:                     4.63GB              512Mb                463Mb    453Mb    432Mb
TOTAL:                  90.8GB              9.41Gb               9.07Gb   8.79Gb   8.40Gb
Line-by-Line Explanation
10.240.0.12 => 203.0.113.89: The local gateway (10.240.0.12) is transmitting directly to a public external IP (203.0.113.89).8.42Gb 8.15Gb 7.80Gb: The 2-second rate (8.42 Gbps) is climbing well above the 40-second average (7.80 Gbps), confirming an aggressive data transfer consuming over 84% of the physical link.TX cumm: 86.2GB | peak: 8.90Gb: This single connection has transferred over 86 GB in this session alone.
What the Administrator Does Next
Track down the offending process with ss and block or throttle the destination IP immediately:
# Find the process connected to the destination IP
ss -tanp 'dst 203.0.113.89'

# Block the outbound flood at the firewall level
sudo iptables -I OUTPUT -d 203.0.113.89 -j DROP
Use Case 2: Tracking Costly Cross-VPC and Subnet Egress Spikes
The Scenario
Your monthly cloud bill shows thousands of dollars in unexpected cross-Availability-Zone data transfer charges. You need to identify which internal database replica or cache cluster is sending uncompressed traffic outside the local subnet (10.100.0.0/16).
The Command
sudo iftop -n -N -i eth0 -F 10.100.0.0/16
Terminal Output
200Mb             400Mb             600Mb             800Mb             1.00Gb
------------------------------------------------------------------------------
10.100.12.4       => 10.200.44.18        620Mb     615Mb     590Mb     18.2GB
                  <=                     2.40Mb    2.30Mb    2.10Mb     72.0MB
10.100.12.4       => 10.100.8.99         14.2Mb    13.8Mb    14.0Mb      420MB
                  <=                     18.1Mb    17.5Mb    17.9Mb      540MB
10.100.12.4       => 10.200.44.19        310Mb     305Mb     295Mb      9.10GB
                  <=                     1.10Mb    1.05Mb    1.00Mb     31.0MB
------------------------------------------------------------------------------
TX:             cumm:   27.7GB      peak:   980Mb       rates:   944Mb    934Mb    899Mb
RX:                     643MB               25.0Mb               21.6Mb   20.8Mb   21.0Mb
TOTAL:                  28.3GB              1.00Gb               966Mb    955Mb    920Mb
Line-by-Line Explanation
-F 10.100.0.0/16: Tellsiftopto only display traffic flowing into or out of your primary internal subnet.10.100.12.4 => 10.200.44.18 (620Mb)and10.100.12.4 => 10.200.44.19 (310Mb): Highlights two massive outbound streams targeting hosts in the10.200.0.0/16secondary subnet.- Over 930 Mbps of combined bandwidth is leaving the local zone continuously, pinpointing the exact source of the cloud billing spike.
What the Administrator Does Next
Check the services running on 10.100.12.4 and enable wire compression for cross-zone replication:
# Verify the listening application on the node
sudo ss -tulpn | grep 10.100.12.4

# Reconfigure the database cluster to enable wire compression (e.g. zstandard) across regions
Use Case 3: Isolating Unauthorized Data Exfiltration and Rogue Outbound Connections
The Scenario
A security monitoring alert flags anomalous outbound HTTPS connections originating from a sensitive payment server. You need to inspect port 443 traffic leaving for external networks while ignoring routine internal cluster communication.
The Command
sudo iftop -n -N -P -i eth0 -f "tcp and dst port 443 and not dst net 10.0.0.0/8"
Terminal Output
50.0Mb            100Mb             150Mb             200Mb             250Mb
------------------------------------------------------------------------------
10.0.4.15:49812   => 198.51.100.77:443    185Mb     179Mb     142Mb     1.85GB
                  <=                      1.12Mb    1.05Mb    890Kb     11.2MB
10.0.4.15:51204   => 203.0.113.14:443     45.2Mb    44.0Mb    38.1Mb     452MB
                  <=                      310Kb     290Kb     240Kb     3.10MB
10.0.4.15:38890   => 192.0.2.200:443      1.20Mb    1.15Mb    1.10Mb    12.0MB
                  <=                      45.0Kb    42.0Kb    40.0Kb     450KB
------------------------------------------------------------------------------
TX:             cumm:   2.31GB      peak:   245Mb       rates:   231Mb    224Mb    181Mb
RX:                     14.7MB              1.80Mb               1.47Mb   1.38Mb   1.17Mb
TOTAL:                  2.33GB              247Mb                233Mb    226Mb    182Mb
Line-by-Line Explanation
-f "tcp and dst port 443 and not dst net 10.0.0.0/8": Kernel-level BPF filter that inspects only outbound TCP traffic destined for port 443 outside the private10.0.0.0/8network.10.0.4.15:49812 => 198.51.100.77:443: An ephemeral port (49812) is transmitting 185 Mbps to an external address.- The high ratio of transmit (
185Mb) to receive (1.12Mb) is a classic signature of bulk data upload or exfiltration.
What the Administrator Does Next
Identify the process ID bound to socket 49812 and terminate it immediately:
# Locate the process attached to source port 49812
sudo ss -tanp '( sport = :49812 )'

# Terminate the rogue binary (e.g. PID 18492)
sudo kill -9 18492
Use Case 4: Non-Interactive Headless Captures for Automated Incident Response
The Scenario
Your automated incident response system needs to capture a bandwidth snapshot whenever high network alarms fire. Because automated scripts run without an interactive terminal (TTY), standard ncurses screens fail.
The Command
sudo iftop -t -s 10 -L 5 -n -N -i eth0
Terminal Output
interface: eth0
IP address is: 172.31.16.8
MAC address is: 06:b4:a1:88:99:aa
Sampling for 10 seconds, emitting 1 iteration(s)...

# Host name (port)                    last 2s   last 10s   last 40s   cumulative
----------------------------------------------------------------------------------
   1 172.31.16.8:9092              =>    240Mb      235Mb      210Mb      294MB
     172.31.40.100:41280           <=    4.10Mb     3.90Mb     3.80Mb     5.12MB
   2 172.31.16.8:9092              =>    180Mb      175Mb      165Mb      220MB
     172.31.40.101:58492           <=    2.80Mb     2.70Mb     2.60Mb     3.48MB
   3 172.31.16.8:22                =>    120Kb      110Kb      105Kb      150KB
     10.0.1.50:50112               <=    12.0Kb     11.0Kb     10.5Kb     15.0KB
----------------------------------------------------------------------------------
Total send rate:                         420Mb      410Mb      375Mb
Total receive rate:                      6.91Mb     6.61Mb     6.41Mb
Total combined rate:                     427Mb      417Mb      381Mb
Peak combined rate (across sample):      445Mb
Line-by-Line Explanation
-t: Runs in text mode, producing standard stdout text streams instead of full-screen terminal control codes.-s 10: Collects data for exactly 10 seconds and then exits with status0.-L 5: Restricts output to the top 5 conversations to keep log sizes clean.- The output captures a Kafka broker (
port 9092) pushing over 420 Mbps across two downstream consumers.
What the Administrator Does Next
Pipe the snapshot directly into incident log storage or attach it to a ticket:
sudo iftop -t -s 10 -L 10 -n -N -i eth0 > /var/log/incident_$(date +%s)_network.log
Use Case 5: Monitoring Virtual Bridges in Container and Kubernetes Environments
The Scenario
On a shared Docker or Kubernetes worker node, several microservices communicate over a virtual bridge (docker0). One container enters a tight error loop, flooding the local network gateway and starving neighboring containers.
The Command
sudo iftop -n -N -P -i docker0
Terminal Output
100Mb             200Mb             300Mb             400Mb             500Mb
------------------------------------------------------------------------------
172.17.0.8:58204  => 172.17.0.1:8080      460Mb     450Mb     410Mb     4.60GB
                  <=                      1.80Mb    1.70Mb    1.50Mb    18.0MB
172.17.0.3:41002  => 10.0.0.5:5432        1.20Mb    1.10Mb    1.15Mb    12.0MB
                  <=                      8.40Mb    8.10Mb    8.00Mb    84.0MB
172.17.0.5:9100   => 172.17.0.1:45120     110Kb     105Kb     100Kb     1.10MB
                  <=                      4.00Kb    3.80Kb    3.90Kb    40.0KB
------------------------------------------------------------------------------
TX:             cumm:   4.62GB      peak:   485Mb       rates:   461Mb    451Mb    411Mb
RX:                     102MB               11.3Mb               11.2Mb   10.9Mb   10.6Mb
TOTAL:                  4.72GB              496Mb                472Mb    462Mb    422Mb
Line-by-Line Explanation
-i docker0: Attaches packet capture to the virtual Linux bridge rather than the host's physical NIC.172.17.0.8:58204 => 172.17.0.1:8080: Pinpoints container IP172.17.0.8hammering the internal gateway at 460 Mbps.- Other containers (
172.17.0.3and172.17.0.5) receive less than 2% of bridge throughput.
What the Administrator Does Next
Map the container IP to its container ID and stop or restart the offending workload:
# Locate the container ID matching IP 172.17.0.8
docker ps -q | xargs docker inspect --format '{{.Id}}: {{range .NetworkSettings.Networks}}{{.IPAddress}}{{end}}' | grep 172.17.0.8

# Stop the misbehaving container
docker stop <container_id>
5. Performance Tuning, Permissions, and Troubleshooting
Running packet capture tools on multi-gigabit links requires a firm understanding of system overhead, kernel capabilities, and common operational pitfalls.
Managing Packet-Sniffing Overhead
When you run iftop on a 10Gbps or 40Gbps link processing millions of packets per second, copying every single packet header from kernel memory to user space can easily saturate an entire CPU core.
To minimise CPU overhead:
1. Always Use Kernel Filters (-f): By applying a BPF expression, uninteresting packets are dropped early inside the kernel driver before hitting user space.
2. Restrict Subnets (-F): Narrow your focus to specific CIDR ranges so iftop processes only relevant flows.
Granting Capabilities Without Full Root Access
Running diagnostic tools as root violates the principle of least privilege. You can grant packet capture permissions directly to the iftop binary using Linux Capabilities:
# Grant raw packet capture and network administration capabilities
sudo setcap cap_net_raw,cap_net_admin=eip /usr/sbin/iftop

# Verify the assigned capabilities
getcap /usr/sbin/iftop
This allows non-root operations accounts to run network diagnostics safely without granting full root filesystem access.
Choosing the Right Diagnostic Tool
Different Linux network tools operate at different layers of the kernel stack:
| Dimension | iftop |
nethogs |
ss (iproute2) |
|---|---|---|---|
| Data Source | Raw Packet Sockets via libpcap |
/proc/net/tcp & Netlink |
Kernel SOCK_DIAG Netlink |
| Primary Metric | Directional bandwidth per host-pair | Directional bandwidth per local PID | Socket buffer depth, RTT, CWND |
| Routed / Bridge Traffic | Yes (Captures any passing frame) | No (Local sockets only) | No (Local sockets only) |
| Process Attribution | Indirect (Via port cross-reference) | Direct (Shows PID & process name) | Direct (Via -p flag) |
| Performance Overhead | Scales with packet rate | High during rapid socket churn | Minimal (Instant kernel query) |
Three Common Operational Pitfalls
- The Reverse DNS Storm: If you omit
-n,iftopattempts to resolve thousands of remote IP addresses via DNS. Under heavy load, this floods your local DNS servers, degrades network performance further, and causes theiftopUI to freeze. Always run with-n -N. - Bits vs. Bytes Confusion: Network interfaces measure throughput in bits per second (
b/s), whereas application logs and disk tools measure in bytes per second (B/s).iftopdisplays bits by default (Mb). PressingBtoggles the display to bytes (MB). Confusing the two introduces an $8\times$ mathematical error into incident reports. - Promiscuous Mode on Virtual Switches: By default,
libpcapattempts to enable promiscuous mode. In some virtualised environments (such as VMware vSphere or OpenStack with strict port security), this can trigger automatic port security shutdowns. Use-p(iftop -p -n -N) to enforce non-promiscuous monitoring.
6. Today's Takeaway
When bandwidth saturates, high-level dashboards tell you that you have a problem; iftop tells you who is causing it. Log into one of your non-production Linux machines right now and run sudo iftop -n -N -P -i eth0 -m 1G. Spend five minutes practicing the key interactive shortcuts: press P to toggle port display, 1, 2, or 3 to sort by the 2s, 10s, or 40s moving averages, and T to toggle total traffic view. Committing -n -N to muscle memory today ensures that when link saturation strikes in the dead of night, you will identify the culprit in seconds.
Authoritative Technical References & Documentation
- Debian & Ubuntu iftop Manual (Debian Manpages)
- Tcpdump & Libpcap Architecture Documentation (Tcpdump.org)
- Linux Kernel BPF & XDP Documentation (Kernel.org)
- Linux Capabilities Guide (man7.org)
- iproute2 Socket Statistics (ss) Reference (man7.org)
- ArchWiki Network Configuration & Monitoring Guide (ArchWiki)