Equivalent Potential Temperature & Moist Static Energy: How Latent Heat Conservation Diagnoses Air Mass Instability and Convective Fuel
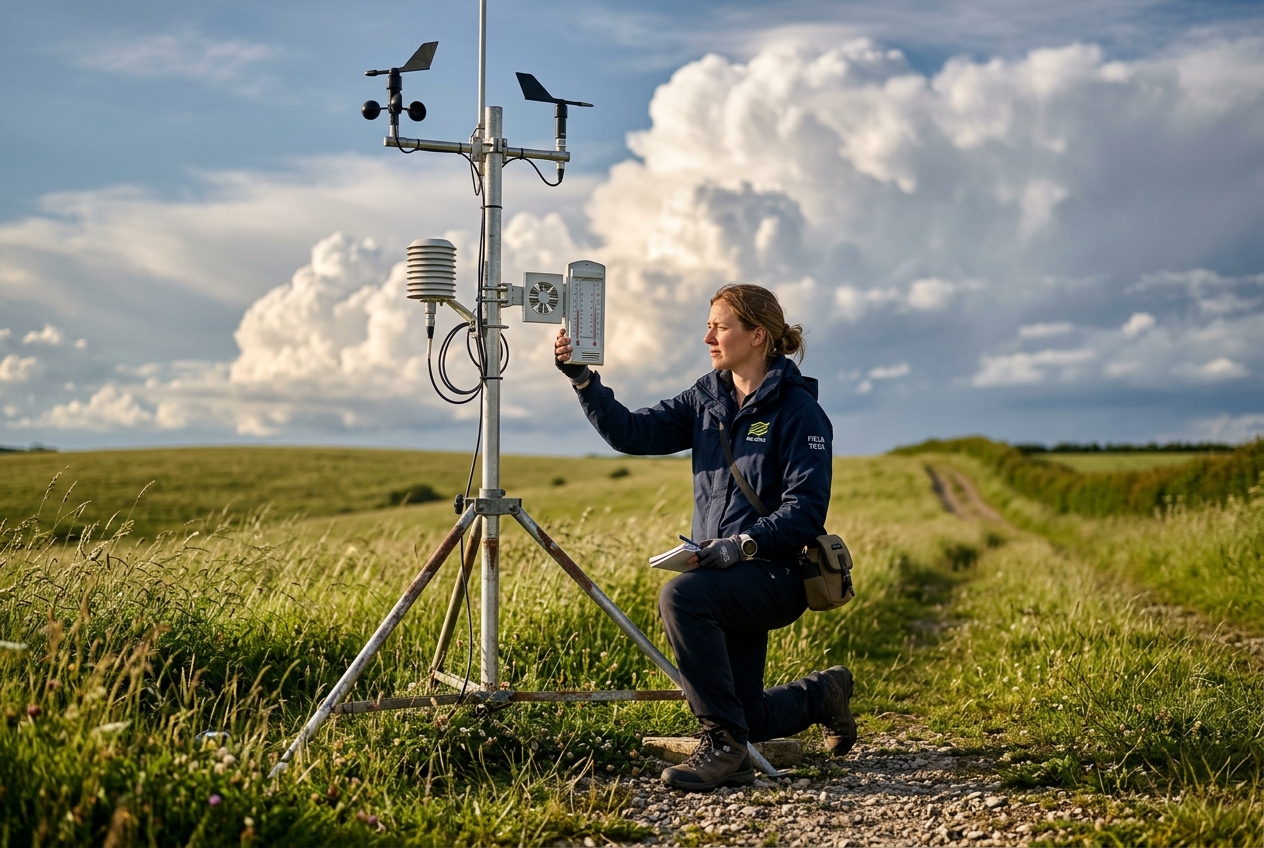
1. Opening Scene
On a windless late-July afternoon across the southern Great Plains, the atmosphere assumes the physical density of a warm, subterranean vault. The skin registers an immediate, clinging warmth; at thirty-four degrees Celsius, the air feels far heavier than mere temperature would suggest. Every breath draws in an invisible, suffocating weight—a vaporous burden carried northward from the Gulf of Mexico on a persistent, low-level atmospheric current.
Underfoot, the clay soil of southwest Oklahoma is dry and fractured, baking beneath a pale, sun-bleached sky. Yet the needle of an antique brass aneroid barometer on the farmhouse porch has begun a steady, rhythmic retreat, ticking downwards by fractions of a millibar every half-hour. There is no surface breeze, but high above the horizon, the atmosphere is beginning to warp.
                       STRATOSPHERE (Stable Cap)
======================================================================
     ^                /             \
     |               |  ANVIL HEAD   |  (-50°C, Glaciated Ice Crystals)
     |                \             /
     |                 |           |
Moist Adiabatic        |  UPDRAFT  |    Latent Heat Release (Lv * q)
  Ascent               |   CORE    |    Accelerates Vertical Motion
     |                 |           |
     |                /  SHELF      \
     |               /    CLOUD      \
     |              /_________________\ (Condensation Level / LCL)
     |                     ^ ^ ^
---------------------------|---|--------------------------------------
SURFACE LAYER: High Theta-e Air Reservoir (T = 34°C, Td = 23°C, 18 g/kg)
To the southwest, the horizon hardens. The hazy summer glaze curdles into towering, cauliflower-shaped turrets of cumulus, their margins defined by crisp, sculptured borders that betray explosive upward momentum. Within forty-five minutes, the solitary towers amalgamate into an ominous, slate-blue rampart. Beneath it, a dark, churning shelf cloud emerges, its turbulent leading edge scraping low across the wheat stubble.
Suddenly, the suffocating stillness gives way. A sudden drop of five degrees occurs in seconds as the gust front arrives, carrying the unmistakable scent of petrichor—dry dust fractured by the first heavy, impact-laden drops of rain—mixed with the faint, sharp tang of ozone. The sky overhead turns an unearthly shade of bruised turquoise. In this brief, electric threshold between oppressive calm and violent atmospheric overturn, the air is releasing an enormous quantity of energy that has been silently accumulating throughout the day.
2. What's Actually Happening — Plain English First
To understand why this violent transformation occurs, we must first recognize that our standard measurement of heat—the reading on an ordinary dry-bulb thermometer—tells only half the thermodynamic story.
Think of the atmosphere as an enormous, multi-layered cake. Each horizontal layer possesses its own distinct temperature, pressure, and weight. If you take a dry parcel of air from the base of this cake and push it upward, it enters regions of progressively lower atmospheric pressure. As the surrounding pressure drops, our parcel expands, pushing outward against the surrounding environment. Because doing this physical work requires energy, the parcel cools at a predictable, fixed rate of roughly $9.8^\circ\text{C}$ for every kilometer it ascends. In classical meteorology, if we adjust for this pressure change by mathematically bringing any air parcel back down to sea level, we obtain its potential temperature (symbolized by the Greek letter $\theta$, or theta).
          DRY PARCEL ASCENT vs. MOIST PARCEL ASCENT

     Altitude (km)
          |
     3 km + - - - - - - - - - - - - - - - - - - - - - - - - -
          |         \ (Cools at ~9.8°C/km)    \ (Cools at ~5°C/km)
          |          \ Dry Adiabat             \ Moist Adiabat
     2 km + - - - - - \ - - - - - - - - - - - - \ - - - - - -
          |            \                         \ [CONDENSATION LEVEL]
          |             \                         * Vapor -> Liquid
     1 km + - - - - - - -\ - - - - - - - - - - - /  Releases Latent Heat
          |               \                     /
     0 km +----------------\-------------------/-------------
                         Parcel A            Parcel B
                       (Bone Dry)         (Vapor-Rich)
However, standard potential temperature harbors a fundamental blind spot: it assumes the air is completely dry. Real-world air is rarely dry; it acts like a sponge saturated with invisible water vapor. Water vapor is far more than passive humidity—it is an energetic chemical reservoir.
When liquid water evaporates from warm oceans or damp soils, it absorbs a massive quantity of thermal energy called the latent heat of vaporization ($L_v$). This energy does not raise the temperature of the water; instead, it is stored within the molecular bonds of the water vapor. The vapor acts like a charged thermodynamic battery.
As long as the air parcel remains warm and unsaturated near the ground, that battery remains dormant. But when the parcel is forced to rise and cools to its dew point, the air can no longer hold its water in vapor form. The sponge is squeezed. The water vapor condenses into liquid cloud droplets, and as it does, the stored latent battery discharges its energy directly into the surrounding parcel.
Instead of cooling rapidly at the dry rate of $9.8^\circ\text{C}$ per kilometer, the condensing parcel cools at a much slower rate—often only $4^\circ\text{C}$ to $6^\circ\text{C}$ per kilometer. Because it remains significantly warmer and lighter than the drier, colder environmental air surrounding it, the parcel accelerates upward like a hot-air balloon whose burner has just been ignited.
To quantify the true, total energy of this moisture-laden air mass, atmospheric scientists developed two essential, deeply connected concepts: Equivalent Potential Temperature ($\theta_e$, or theta-e) and Moist Static Energy ($h$). Both parameters measure what the air's temperature and energy state would be if every single gram of water vapor were completely condensed out and the resulting latent heat was transferred directly into warming the air.
3. The Science (for those who want to go deeper)
To transition from conceptual intuition to quantitative atmospheric physics, we must formulate how latent heat and sensible enthalpy interact during vertical motion. The governing principles are rooted in the First Law of Thermodynamics and the hydrostatic balance documented across authoritative literature from the World Meteorological Organization and the American Meteorological Society.
3.1 Equivalent Potential Temperature ($\theta_e$) and Bolton’s Approximation
The dry potential temperature $\theta$ of an air parcel at absolute temperature $T$ (in Kelvin) and ambient atmospheric pressure $p$ (in hectopascals, $\text{hPa}$) relative to a standard reference pressure $p_0 = 1000\text{ hPa}$ is derived via Poisson's relation:
$$\theta = T \left( \frac{p_0}{p} \right)^{R_d / c_p}$$
where $R_d = 287.058\text{ J}\cdot\text{kg}^{-1}\cdot\text{K}^{-1}$ is the specific gas constant for dry air, and $c_p = 1005.7\text{ J}\cdot\text{kg}^{-1}\cdot\text{K}^{-1}$ is the specific heat capacity of dry air at constant pressure. The exponent $\kappa = R_d / c_p \approx 0.286$.
When an air parcel containing water vapor rises pseudo-adiabatically (where all condensed water immediately falls out of the parcel), the latent heat released per unit mass is given by $L_v \, dq_s$, where $L_v \approx 2.501 \times 10^6\text{ J}\cdot\text{kg}^{-1}$ at $0^\circ\text{C}$ and $q_s$ is the saturation specific humidity. Integrating the thermodynamic energy balance from the parcel's condensation level to the top of the atmosphere yields the theoretical definition of equivalent potential temperature ($\theta_e$):
$$\theta_e \approx \theta \exp\left( \frac{L_v q}{c_p T_L} \right)$$
Here, $q$ is the water vapor mixing ratio (in $\text{kg}\cdot\text{kg}^{-1}$), and $T_L$ is the absolute temperature at the parcel’s Lifting Condensation Level (LCL).
Because the exact integration of the pseudo-adiabatic lapse rate is analytically intractable, atmospheric science relies on the highly accurate empirical formulation established by David Bolton (1980):
$$\theta_e = \theta_L \exp\left[ \left( \frac{3036}{T_L} - 1.78 \right) r \, (1 + 0.448 r) \right]$$
where: - $\theta_L = T \left( \frac{1000}{p - e} \right)^{0.2854} \left( \frac{T}{T_L} \right)^{0.28 \times 10^{-3} r}$ is the potential temperature at the LCL (with vapor pressure $e$ in $\text{hPa}$), - $r$ is the water vapor mixing ratio expressed in grams per kilogram ($\text{g}\cdot\text{kg}^{-1}$), - $T_L$ is the temperature at the LCL in Kelvin, accurately approximated from surface temperature $T$ and dew point $T_d$ as:
$$T_L = \frac{1}{\frac{1}{T_d - 56} + \frac{\ln(T / T_d)}{800}} + 56$$
Worked Example: Quantifying the Latent Energy Surge
Consider a surface parcel measured across the southern plains: - Surface Pressure: $p = 970\text{ hPa}$ - Surface Temperature: $T = 34^\circ\text{C} = 307.15\text{ K}$ - Surface Dew Point: $T_d = 23^\circ\text{C} = 296.15\text{ K}$ - Mixing Ratio: $r \approx 18.0\text{ g}\cdot\text{kg}^{-1} = 0.018\text{ kg}\cdot\text{kg}^{-1}$
First, calculate dry potential temperature ($\theta$): $$\theta = 307.15 \times \left( \frac{1000}{970} \right)^{0.286} = 307.15 \times (1.0309)^{0.286} \approx 309.8\text{ K} \quad (36.65^\circ\text{C})$$
Next, estimate the LCL temperature: $$T_L \approx T_d - \left( \frac{T - T_d}{4.4} \times 4.4 \times 0.22 \right) \approx 296.15 - (11 \times 0.22 \times \dots) \approx 290.5\text{ K}$$
Using the exponential approximation: $$\frac{L_v q}{c_p T_L} = \frac{(2.501 \times 10^6\text{ J}\cdot\text{kg}^{-1}) \times (0.018\text{ kg}\cdot\text{kg}^{-1})}{(1005.7\text{ J}\cdot\text{kg}^{-1}\cdot\text{K}^{-1}) \times (290.5\text{ K})} = \frac{45018}{292155.85} \approx 0.1541$$
Now calculate $\theta_e$: $$\theta_e \approx 309.8 \times \exp(0.1541) \approx 309.8 \times 1.1666 \approx 361.4\text{ K} \quad (88.25^\circ\text{C})$$
Key Takeaway: Accounting for moisture elevates the parcel's effective thermodynamic baseline from $309.8\text{ K}$ to an astonishing $361.4\text{ K}$. That $51.6\text{ K}$ difference represents the raw fuel driving vertical updrafts.
3.2 Moist Static Energy (MSE) and its Conservation
In large-scale dynamic meteorology and numerical modeling, atmospheric physicists frequently employ Moist Static Energy ($h$), a variable closely aligned with $\theta_e$ but expressed directly in energy per unit mass ($\text{J}\cdot\text{kg}^{-1}$):
$$h = c_p T + g z + L_v q$$
The equation decomposes total parcel energy into three distinct terms: 1. Sensible Enthalpy ($c_p T$): The internal kinetic energy measurable with a thermometer. 2. Geopotential Potential Energy ($g z$): The mechanical energy stored by lifting mass against Earth's gravitational acceleration ($g = 9.80665\text{ m}\cdot\text{s}^{-2}$) to height $z$. 3. Latent Energy ($L_v q$): The chemical/phase potential energy stored within water vapor.
During dry adiabatic ascent, sensible enthalpy is converted into geopotential energy ($d(c_p T + gz) = 0$), preserving dry static energy ($s = c_p T + gz$). During moist adiabatic ascent, condensation converts latent energy into sensible heat, which is simultaneously converted into geopotential energy:
$$\frac{dh}{dt} \approx 0$$
Both $\theta_e$ and $h$ are quasi-conserved for a rising air parcel under adiabatic conditions, meaning their values remain constant regardless of whether the parcel is at the ground, passing through a cloud base, or venting into the upper troposphere. This property allows meteorologists to trace the geographic origin of air masses across synoptic scales.
3.3 Convective (Potential) Instability: $\frac{\partial \theta_e}{\partial z} < 0$
The most dangerous atmospheric condition diagnosed by equivalent potential temperature is convective instability (also known as potential instability).
Traditional parcel theory examines whether an individual parcel is warmer than its immediate surroundings. Convective instability, however, evaluates what happens when an entire atmospheric layer is lifted simultaneously by a front, a dryline, or topographic forcing.
       CONVECTIVE INSTABILITY: LAYER LIFTING PROFILE

Altitude
   ^          Top of Layer: DRY AIR (High LCL)
   |          Lifts dry-adiabatically (Cools fast @ 9.8°C/km)
   |          ==================================================> Becomes Very Cold
   |
   |          Base of Layer: MOIST AIR (Low LCL)
   |          Saturates quickly -> Cools moist-adiabatically (@ 5°C/km)
   |          ==================================================> Stays Relatively Warm
   +-------------------------------------------------------------> Temperature (T)

   RESULT: The lapse rate across the layer steepens drastically (dT/dz becomes extreme).
           The entire layer becomes violently unstable!
Mathematical condition for convective instability:
$$\frac{\partial \theta_e}{\partial z} < 0$$
When a layer has high $\theta_e$ at its base (warm, tropical, moisture-rich air) and low $\theta_e$ at its top (dry, mid-tropospheric air advected from deserts or the high plateau): 1. As the entire layer is pushed upward, the humid base quickly reaches its dew point and begins ascending along a moist adiabat, cooling at only $\sim 5^\circ\text{C/km}$. 2. The dry upper portion of the layer must lift much farther before reaching saturation; it cools along the dry adiabat at $\sim 9.8^\circ\text{C/km}$. 3. Consequently, the top of the layer cools at nearly twice the rate of the bottom. The temperature differential between the base and top expands, dramatically steepening the environmental lapse rate.
An atmospheric layer that was initially stable and capped by a temperature inversion can suddenly burst into extreme instability, releasing thousands of Joules per kilogram of Convective Available Potential Energy (CAPE).
3.4 The Synoptic "$\theta_e$ Ridge"
On regional weather maps, meteorologists plot contours of constant $\theta_e$ at the surface and at $850\text{ hPa}$. A narrow, northward-extending axis of elevated values is known as a $\theta_e$ ridge (or theta-e plume).
                      SYNOPTIC THETA-E RIDGE SETUP

                      500 hPa Jet Stream (Cold, Dry Air Aloft)
                    =========================================>
                                       |
                                       v
     Elevated Mixed Layer (EML)        |     Low-Level Jet (LLJ)
   [Dry, Warm Air from Desert SW]      |   [High Theta-e Air from Gulf]
                 \                     |               /
                  \                    |              /
                   \                   |             /
                    v                  v            v
    -----------------------------------------------------------------
    WEST                          DRYLINE / FRONT                EAST
    (Low Surface Theta-e)         [Focus of Explosive           (High Theta-e
                                      Convection]                 Reservoir)
As the NOAA Storm Prediction Center routinely documents, this configuration represents the classic severe weather pattern across central North America: - A strong low-level jet streams northward from the Gulf of Mexico, transporting air with $\theta_e > 345\text{ K}$. - At mid-levels ($700\text{–}500\text{ hPa}$), an Elevated Mixed Layer (EML) containing dry air with steep lapse rates advects eastward from the Mexican Plateau. - The superposition of this dry air mass over the high-$\theta_e$ surface air creates a stark $\partial \theta_e / \partial z < 0$ vertical profile. - When an approaching shortwave trough provides synoptic lift along the dryline or cold front, the cap erodes, and the convective instability is released in explosive supercell thunderstorms.
4. Practical Outdoor Guidance
You do not need access to a supercomputer or complex thermodynamic software to observe and interpret these principles in the field. By combining visual cues with basic instruments, any outdoor observer can assess atmospheric energy and instability.
What to Look for in the Sky
- Morphology of Cumulus Clouds: Watch the edges of growing cumulus clouds. Fluffy, ragged, or evaporating edges indicate dry environmental air and low moisture content. In contrast, sharp, cauliflower-like contours with hard, solid margins signal rapid moist ascent within an atmosphere rich in equivalent potential temperature.
- Mid-Level Altocumulus Castellanus: Turreted, castle-like clouds visible during the morning or early afternoon are clear indicators of instability aloft ($\partial \theta_e / \partial z < 0$). They show that mid-tropospheric layers are destabilizing even before surface-based heating reaches its peak.
- Sky Color and Cloud Bases: Exceptionally low, dark, uniform cloud bases indicate high surface mixing ratios and low LCL heights. A green or turquoise hue in a storm core suggests large quantities of suspended liquid water droplets and hail, sustained by updrafts energized by extreme $\theta_e$ values.
+-------------------------------------------------------------------------+
|                    FIELD OBSERVER INSTRUMENT CHECKLIST                  |
+-------------------------------------------------------------------------+
| Instrument         | Critical Threshold    | Atmospheric Implication   |
+--------------------+-----------------------+----------------------------+
| Dew Point ($T_d$)  | $> 18°C$ (65°F)       | Sufficient for convection  |
|                    | $> 21°C$ (70°F)       | High-energy storm fuel     |
+--------------------+-----------------------+----------------------------+
| Barometer Trend    | Falling $> 1.5 hPa/hr | Dynamic lifting active     |
+--------------------+-----------------------+----------------------------+
| Surface Wind       | Backing to S or SE    | Low-level moisture inflow  |
+--------------------+-----------------------+----------------------------+
Instrument Readings to Monitor
- The Hygrometer / Dew Point: Pay closer attention to dew point than relative humidity. A temperature of $35^\circ\text{C}$ with a dew point of $10^\circ\text{C}$ feels hot but represents dry air with low $\theta_e$. Conversely, a temperature of $30^\circ\text{C}$ paired with a dew point of $23^\circ\text{C}$ marks a volatile thermodynamic air mass with $\theta_e > 355\text{ K}$.
- The Aneroid Barometer: A steady or rising barometer indicates subsidence (sinking air), which suppresses cloud growth regardless of surface heat. A rapidly falling barometer indicates synoptic-scale upward motion, which lifts moist layers and triggers convective instability.
- Wind Direction (Backing vs. Veering): If surface winds blow from the south or southeast while clouds aloft drift from the west or southwest, winds are veering with height. This kinematic profile transports moisture into the lower levels while advecting dry air aloft—the ideal configuration for steepening $\partial \theta_e / \partial z$.
A Simple Field Rule of Thumb for Cloud Base Height
You can estimate the cloud base (Lifting Condensation Level) in meters using the Esposito-Hennig approximation:
$$\text{Cloud Base Height (meters)} \approx 125 \times (T - T_d)$$
where $T$ and $T_d$ are the surface temperature and dew point in degrees Celsius.
Example: If $T = 30^\circ\text{C}$ and $T_d = 22^\circ\text{C}$, the spread is $8^\circ\text{C}$. $$\text{Height} \approx 125 \times 8 = 1000\text{ meters above ground level}$$
A low LCL ($< 1000\text{ m}$) combined with high ambient temperature indicates an air parcel that reaches saturation quickly, retaining maximum latent heat for its subsequent ascent.
5. Today's Meteorological Rule of Thumb
The Field Observer's Law of Latent Energy
"Temperature sets the ceiling of comfort, but dew point sets the ceiling of storms."
Never judge the atmosphere’s convective potential by the thermometer alone. A hot, dry day is thermodynamically dormant; a warm, humid day with a high equivalent potential temperature ($\theta_e$) is a loaded spring awaiting a trigger.
Authoritative References and Further Reading
- NOAA Storm Prediction Center: Sounding Analysis & Parameter Guide
- World Meteorological Organization: International Cloud Atlas
- American Meteorological Society: Glossary of Meteorology
- UK Met Office: Atmospheric Stability and Thermodynamics
- National Weather Service: Thermodynamic Equations & Calculations