Atmospheric Tides & Diurnal Barometric Oscillations: How Solar Thermal Excitation and Stratospheric Resonance Drive Global Twice-Daily Pressure Waves
1. Opening Scene: The Ghost in the Barograph
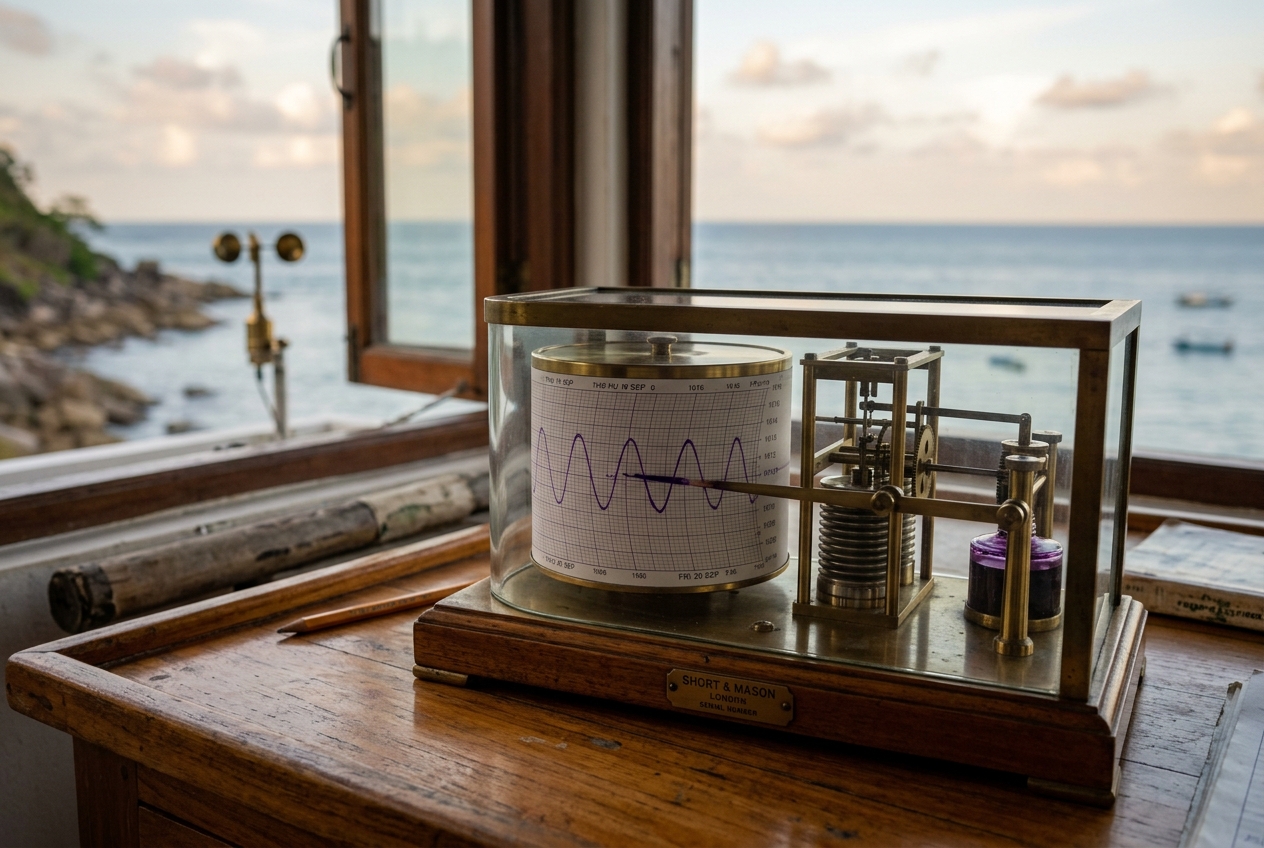
Ten degrees north of the equator, three hundred nautical miles southwest of Costa Rica, the ocean rests as a sheet of burnished lead. In the dead stillness of the Intertropical Convergence Zone, the trade winds have unraveled into glass-calm doldrums. The air is an oppressive, saturated sponge, tasting faintly of salt and evaporated brine. On the chart table of the vessel, the brass arm of an antique mechanical barograph sweeps silently across its ink-lined drum, accompanied by the cold luminescence of a precision quartz microbarometer reporting to a hundredth of a hectopascal.
To the untrained mariner, the atmosphere feels dormant. Yet, every single day, without regard to passing cirrus or unrelenting equatorial sun, the barometer stages a rhythmic, uncanny drama.
At four in the morning, under the silver cast of the southern constellations, the mercury rests at a quiet nadir. By six, as the dawn breaks in an explosion of ochre and gold across the glassy swells, the trace begins an inexorable ascent. By ten o'clock sharp, the barograph reaches a distinct peak, bulging upward by nearly two and a half hectopascals. Then, as the midday sun beats vertically into the sea, the pressure begins a steep slide, bottoming out precisely around four in the afternoon (16:00 local time). As twilight gathers, the invisible wave reverses course again, climbing steadily to a secondary nocturnal peak at ten in the evening (22:00), before sinking to its nocturnal trough at four in the morning.
No cloud wall has rolled over the horizon. No cold front exists within a thousand leagues. The sea surface temperature has barely shifted half a degree. Yet the weight of the entire planetary column overhead has risen and fallen twice in twenty-four hours with the precision of a Swiss chronometer. This is the heartbeat of Earth’s gaseous envelope: the solar atmospheric tide.
2. What is Actually Happening: Plain English First
When we hear the word "tide," our intuition points immediately to the Moon. We picture the gravitational tug of our lunar neighbor dragging oceans across continental shelves, producing the twice-daily high and low waters familiar to coastal fishermen. It is natural to assume that the atmosphere—being a fluid ocean of gas resting atop the sea—must respond to the Moon in identical fashion.
Yet, if you correlate the daily pressure surges on your barometer with the position of the Moon, you will find virtually no connection. The atmospheric tide does not follow the lunar transit; it marches in lockstep with the Sun.
Why does the atmosphere defy lunar gravity?
The answer lies in the fundamental physics of fluid mass versus fluid compressibility. The Moon's gravitational pull exerts a force strictly proportional to mass. Water is dense (roughly 1,000 kilograms per cubic meter) and virtually incompressible; the Moon tugs on the vast bulk of the ocean, displacing massive fluid volumes. Air, by contrast, is light (about 1.2 kilograms per cubic meter at sea level) and exceptionally compressible. While the lunar gravitational force does indeed pull on the atmosphere—generating a real "lunar atmospheric tide"—the resulting barometric signal is microscopic, rarely exceeding 0.01 to 0.03 hPa at the equator. It is so faint that it can only be extracted from decades of barometric records using complex Fourier statistical filtering.
The barometric oscillation you observe on an everyday barometer is not a gravitational tide at all. It is a thermal tide—a global acoustic-gravity wave driven by the radiant heat of the Sun.
Think of the atmosphere as a vast, resonant crystal bell wrapped around the globe. As the Earth rotates beneath the Sun, the solar furnace strikes this bell. But the heating does not occur at the ground. If the ground heated the air from below, the atmosphere would expand upward, creating a simple once-per-day (diurnal) pressure drop during the hottest part of the afternoon.
Instead, the Sun strikes the atmosphere simultaneously across two elevated altitude zones: 1. The Middle Stratosphere (30 to 60 km altitude): Solar ultraviolet radiation is absorbed by the stratospheric ozone layer within the Hartley and Huggins absorption bands ($200\text{ to }310\text{ nm}$). 2. The Lower and Middle Troposphere (0 to 10 km altitude): Solar near-infrared radiation is directly absorbed by atmospheric water vapor across the $0.9\text{ to }3.2\ \mu\text{m}$ molecular bands.
This two-tiered radiant injection acts like a pair of coordinated hands rhythmically squeezing and expanding the planetary gas layer. Because the Earth spins at a steady angular velocity, this thermal forcing injects energy across harmonic frequencies: once per day ($24\text{ hours}$, the diurnal $S_1$ mode), twice per day ($12\text{ hours}$, the semidiurnal $S_2$ mode), three times per day ($8\text{ hours}$, the terdiurnal $S_3$ mode), and four times per day ($6\text{ hours}$, the quaterdiurnal $S_4$ mode).
Curiously, when you look at a tropical barometer, the 12-hour ($S_2$) wave is almost always larger and cleaner than the 24-hour ($S_1$) wave, despite the Sun only rising and setting once per day. The atmosphere acts as a selective acoustic filter: the 12-hour semidiurnal wave matches the global resonant geometry of the Earth's atmosphere, allowing it to propagate cleanly around the planet with minimal destructive interference, while the 24-hour wave undergoes severe destructive phase cancellation across different altitudes.
3. The Science: Classical Tidal Theory and Mathematical Framework
To understand why the semidiurnal wave dominates surface pressure records, atmospheric scientists rely on the classical hydrodynamic foundations laid out in Laplace's Tidal Equations and the vertical structure theory codified by Sydney Chapman and Richard Lindzen.
The Dynamics of Hough Modes and Vertical Resonance
When linearized primitive equations on a rotating sphere are separated into horizontal and vertical components, the horizontal variations are governed by Laplace's Tidal Equations. The solutions to these equations are orthogonal mathematical functions known as Hough Functions ($\Theta_{n,s}$), where $s$ represents the zonal wavenumber (number of wave cycles around a latitude circle) and $n$ denotes the meridional index.
For each Hough mode, there exists an associated eigenvalue called the equivalent depth ($h_{n,s}$). This equivalent depth determines how the wave propagates vertically through the atmosphere via the vertical structure equation:
$$\frac{d^2 y}{dz^2} + \left[ \frac{1}{H} \frac{dH}{dz} \left( \frac{\kappa H}{h_{n,s}} - \frac{1}{4} \right) + \frac{\kappa}{h_{n,s}} \left( \frac{\gamma - 1}{\gamma} + \frac{dH}{dz} \right) \right] y = J(z)$$
Where: * $z$ is the log-pressure vertical coordinate, * $H = \frac{R_d T}{g}$ is the atmospheric scale height ($\sim 7.5\text{ to }8.5\text{ km}$), * $\kappa = \frac{R_d}{C_p} \approx \frac{2}{7} \approx 0.286$, * $\gamma = \frac{C_p}{C_v} \approx 1.4$, * $J(z)$ represents the vertical distribution of thermal radiative forcing.
When the equivalent depth $h_{n,s}$ is large (as is the case for the primary semidiurnal Hough mode, the symmetric $\Theta_{2,2}$ mode where $h_{2,2} \approx 7.85\text{ km}$), the vertical wavelength of the wave is exceptionally long ($\lambda_z > 100\text{ km}$). Because the vertical scale of the atmosphere itself is on the order of tens of kilometers, the wave does not complete a full phase reversal between the stratospheric ozone heating source and the sea surface. Consequently, the pressure oscillations generated in the upper atmosphere and lower troposphere reinforce one another constructively, producing a large, coherent, global-scale pressure oscillation at sea level.
Conversely, the primary diurnal mode ($\Theta_{1,1}$) has a very small equivalent depth ($h_{1,1} \approx 0.7\text{ km}$), yielding a short vertical wavelength ($\lambda_z \approx 12\text{ km}$). As this wave propagates downward from the stratosphere, it undergoes multiple internal reflections and destructive phase cancellations across the troposphere. The wave destroys itself before its full energy can register at the surface, leaving the semidiurnal $S_2$ oscillation as the undisputed master of the barograph trace.
Equation 1: The Equatorial Semidiurnal Amplitude Relation
To calculate the expected sea-level pressure variation driven by the semidiurnal atmospheric tide at any latitude and solar time, meteorologists and oceanographers use an empirical-harmonic formulation derived from global surface station networks:
$$\Delta P_{S_2}(\phi, t_s) = A_0 \cos^3(\phi) \cos\left( \frac{4\pi}{24} (t_s - t_{\text{peak}}) \right)$$
Plain English Meaning
This equation states that the tidal pressure anomaly ($\Delta P_{S_2}$) depends entirely on your latitude ($\phi$) and the local solar time ($t_s$). The maximum amplitude ($A_0$) occurs at the equator ($\phi = 0^\circ$), where solar heating is most direct. As you travel toward the poles, the amplitude diminishes rapidly following a cubic cosine decay ($\cos^3\phi$). The wave reaches its maximum positive anomaly at $t_{\text{peak}} \approx 10:00$ and $22:00$ local solar time, and its deepest negative anomaly six hours later at $04:00$ and $16:00$.
Variable Definitions
- $\Delta P_{S_2}$: Semidiurnal surface pressure anomaly relative to mean station pressure ($\text{hPa}$).
- $A_0$: Equatorial reference peak amplitude, empirically established as $A_0 \approx 1.25\text{ hPa}$ (yielding an absolute peak-to-trough range of $2.50\text{ hPa}$).
- $\phi$: Geographic latitude in degrees or radians.
- $t_s$: Local solar time in decimal hours ($0.00 \text{ to } 23.99$).
- $t_{\text{peak}}$: Phase peak offset time, precisely $10.00\text{ hours}$ (representing the 10:00 and 22:00 local maxima).
Step-by-Step Worked Example: Calculating Tidal Offset
Let us calculate the expected tidal pressure anomaly for a research vessel stationed in the Caribbean Sea off Barbados at latitude $\phi = 13.2^\circ\text{N}$, at $16:00$ local solar time ($t_s = 16.0$).
-
Calculate the latitudinal geometric factor: $$\phi = 13.2^\circ \implies \cos(13.2^\circ) \approx 0.97358$$ $$\cos^3(13.2^\circ) = (0.97358)^3 \approx 0.9228$$
-
Compute the base tidal amplitude for this latitude: $$A(\phi) = A_0 \cdot \cos^3(\phi) = 1.25\text{ hPa} \times 0.9228 \approx 1.1535\text{ hPa}$$
-
Calculate the harmonic phase angle: $$\theta_{\text{phase}} = \frac{4\pi}{24} (t_s - t_{\text{peak}}) = \frac{\pi}{6} (16.0 - 10.0) = \frac{\pi}{6} \times 6.0 = \pi \text{ radians} = 180^\circ$$
-
Evaluate the cosine phase function: $$\cos(\pi) = -1.000$$
-
Calculate the final tidal pressure anomaly: $$\Delta P_{S_2}(13.2^\circ, 16.0) = 1.1535\text{ hPa} \times (-1.000) = -1.15\text{ hPa}$$
At 16:00 local time in Barbados, the solar thermal tide naturally suppresses the local barometer by $1.15\text{ hPa}$ below the daily mean, completely independent of synoptic weather systems.
Isolating True Weather: The Isallobaric Extraction Problem
In mid-latitudes (such as London, New York, or Paris), weather systems are violent and dynamic. Extratropical cyclones routinely cause pressure drops of $10\text{ to }30\text{ hPa}$ in twenty-four hours, entirely swamping the weak $0.2\text{ hPa}$ atmospheric tides present at $50^\circ\text{N}$.
In the tropics, however, the synoptic pressure background is remarkably flat. Normal day-to-day pressure variations across the trade wind belt rarely exceed $1\text{ to }2\text{ hPa}$. Under these conditions, the diurnal atmospheric tide represents the largest single signal on the barometer.
This creates a critical operational hazard for tropical meteorologists and mariners: How do you detect the subtle, life-threatening pressure fall that signals an organizing tropical depression or hurricane when the barometer is naturally rising and falling by $2.5\text{ hPa}$ every day?
To solve this, forecasters calculate the isallobar—the true synoptic pressure tendency over a three-hour window ($\Delta P_{\text{synoptic}, 3\text{h}}$)—by mathematically subtracting the expected tidal tendency from the observed gross pressure change.
       DECONSTRUCTING THE OBSERVED PRESSURE SIGNAL
  Observed Gross Change  =  [ True Synoptic Tendency ] + [ Diurnal Tidal Wave ]
      (On Barograph)        (Cyclogenesis / Air Mass)     (Solar Resonance)
Equation 2: The Three-Hour Isallobaric Tendency Equation
$$\Delta P_{\text{synoptic}}(t_s) = \left[ P_{\text{obs}}(t_s) - P_{\text{obs}}(t_s - 3) \right] - \left[ \Delta P_{\text{tide}}(t_s) - \Delta P_{\text{tide}}(t_s - 3) \right]$$
Plain English Meaning
To find out whether the atmosphere is genuinely deteriorating due to an approaching cyclone, take your raw 3-hour pressure change measured on your barometer, and subtract the change that the planetary solar tide was supposed to cause over that exact same 3-hour window. If the remaining number is negative and exceeds specific operational thresholds, you are in the path of a developing tropical cyclone.
Operational Case Study: Tropical Cyclogenesis Detection
Imagine you are the chief navigation officer aboard a container vessel traversing the Philippine Sea at latitude $\phi = 12.0^\circ\text{N}$. It is $16:00$ local solar time. The sky shows scattered cumulus clouds with high, thin veil-like cirrostratus radiating from the eastern horizon.
You inspect the barometric log: * Barometer reading at $13:00$ ($t_s = 13.0$): $1010.80\text{ hPa}$ * Barometer reading at $16:00$ ($t_s = 16.0$): $1007.60\text{ hPa}$
The raw observed 3-hour pressure change is: $$\Delta P_{\text{obs}, 3\text{h}} = 1007.60 - 1010.80 = -3.20\text{ hPa}$$
An inexperienced sailor looks at the barometer, recalls that the afternoon is a natural tidal trough, and shrugs off the $-3.20\text{ hPa}$ fall as normal diurnal variation. This mistake has historically cost ships their lives.
Let us run the rigorous isallobaric reduction:
-
Calculate the expected tidal anomaly at $t_s = 13.0$ (13:00): * $\phi = 12.0^\circ \implies \cos^3(12.0^\circ) = (0.9781)^3 \approx 0.9358$ * Tidal amplitude: $A(12^\circ) = 1.25 \times 0.9358 = 1.170\text{ hPa}$ * Phase at 13:00: $\theta_1 = \frac{\pi}{6}(13.0 - 10.0) = \frac{3\pi}{6} = \frac{\pi}{2} = 90^\circ$ * $\Delta P_{\text{tide}}(13.0) = 1.170 \times \cos(90^\circ) = 1.170 \times 0.000 = 0.000\text{ hPa}$
-
Calculate the expected tidal anomaly at $t_s = 16.0$ (16:00): * Phase at 16:00: $\theta_2 = \frac{\pi}{6}(16.0 - 10.0) = \pi = 180^\circ$ * $\Delta P_{\text{tide}}(16.0) = 1.170 \times \cos(180^\circ) = 1.170 \times (-1.000) = -1.170\text{ hPa}$
-
Calculate the expected 3-hour tidal tendency ($\Delta P_{\text{tide}, 3\text{h}}$): $$\Delta P_{\text{tide}, 3\text{h}} = \Delta P_{\text{tide}}(16.0) - \Delta P_{\text{tide}}(13.0) = -1.170 - 0.000 = -1.170\text{ hPa}$$
-
Extract the True Synoptic Isallobaric Tendency ($\Delta P_{\text{synoptic}}$): $$\Delta P_{\text{synoptic}} = \Delta P_{\text{obs}, 3\text{h}} - \Delta P_{\text{tide}, 3\text{h}}$$ $$\Delta P_{\text{synoptic}} = (-3.20\text{ hPa}) - (-1.17\text{ hPa}) = -2.03\text{ hPa}$$
========================================================================
ISALLOBARIC REDUCTION REPORT: PHILIPPINE SEA (12.0°N)
------------------------------------------------------------------------
Observed Gross 3-Hour Tendency:           -3.20 hPa
Expected Natural Diurnal Tidal Component: -1.17 hPa
------------------------------------------------------------------------
NET SYNOPTIC TENDENCY (Isallobar):        -2.03 hPa / 3 hours
WMO DANGER THRESHOLD FOR TROPICS:         -1.00 hPa / 3 hours
ALERT STATUS:                             SEVERE CYCLOGENESIS WARNING
========================================================================
According to the guidelines published by the World Meteorological Organization (WMO) and the National Hurricane Center (NOAA/NWS), any corrected tropical 3-hour pressure fall greater than $-1.0\text{ hPa}$ indicates rapid synoptic cyclogenesis or an advancing tropical vortex. Here, the true synoptic fall is $-2.03\text{ hPa}$—more than double the danger threshold. A tropical depression is intensifying rapidly within 100 miles of the vessel.
Aviation Altimeter Setting Calibration
The influence of atmospheric tides extends directly into flight operations. Aircraft barometric altimeters compute altitude above mean sea level by sensing local ambient pressure and referencing it against an altimeter setting ($QNH$) broadcast by airport control towers.
The standard hydrostatic pressure lapse rate near sea level in the International Standard Atmosphere (ISA) is approximately:
$$\frac{\Delta z}{\Delta P} \approx 27\text{ to }30\text{ feet per hPa (approx. } 8.3\text{ to }9.1\text{ meters per hPa)}$$
In tropical international aerodromes (such as Singapore Changi, Panama City Tocumen, or Nairobi), the $2.5\text{ hPa}$ daily tidal excursion alters the pressure altitude reading by:
$$\Delta z_{\text{altimeter}} \approx 2.5\text{ hPa} \times 28\text{ ft/hPa} \approx 70\text{ to }75\text{ feet}$$
If an altimeter setting is not updated continuously between the morning peak ($10:00$) and the afternoon trough ($16:00$), an aircraft parked on the ramp will appear to "climb" over $70\text{ feet}$ in elevation purely because the Sun has heated the upper atmosphere and caused the equatorial air column to redistribute its mass.
4. Practical Outdoor Guidance
Whether navigating a sailboat across the Caribbean, monitoring microclimates on a subtropical farm, or trekking through high-altitude tropical mountains, understanding atmospheric tides transforms the way you interpret environmental data.
What to Look for in the Sky
- The 10:00 / 22:00 Inversion Cap: Around ten in the morning and ten at night, the tidal wave reaches peak convergence at the surface. This downward dynamic compression frequently creates a subtle, temporary stabilization of the lower boundary layer. Early morning cumulus clouds will often flatten into stratocumulus sheets or momentarily pause their vertical ascent.
- The 16:00 Convective Trigger Window: The afternoon tidal minimum at 16:00 coincides almost exactly with peak surface solar heating. The natural tidal divergence at the surface and reduced atmospheric column weight lower the convective inhibition (CIN), providing an effortless hydrodynamic trigger for towering cumulonimbus clouds and explosive afternoon thunderstorms across the tropics.
What Instrument Readings to Watch
- Digital Microbarometer: When logging pressure in the subtropics (latitudes $0^\circ\text{ to }30^\circ$), do not evaluate absolute pressure against a static number. Instead, plot a continuous 24-hour trace. You should see two smooth, symmetrical sinusoidal waves per day.
- Tidal Flatlining: If your barometer fails to rise between $04:00$ and $10:00$, or fails to rise between $16:00$ and $22:00$, an energetic weather disturbance is actively counteracting the planetary tide. A flat barometer during a scheduled tidal rise is functionally equivalent to an alarming pressure drop.
- Anemometer and Wind Vane: In coastal tropical regions, the atmospheric tide interacts with the local sea-breeze circulation. The morning pressure peak enhances offshore gradient breezes, while the afternoon tidal trough deepens the onshore sea-breeze penetration inland.
The Mariner’s and Hiker’s Practical Rule of Thumb
When operating within $30^\circ$ of the equator, memorize the "Tidal Quadrants": 1. 04:00 to 10:00: Barometer MUST rise ($\sim +1.2\text{ hPa}$). 2. 10:00 to 16:00: Barometer MUST fall ($\sim -1.2\text{ hPa}$). 3. 16:00 to 22:00: Barometer MUST rise ($\sim +1.2\text{ hPa}$). 4. 22:00 to 04:00: Barometer MUST fall ($\sim -1.2\text{ hPa}$).
If your instrument drops by more than $3.0\text{ hPa}$ during an afternoon falling quadrant ($10:00\text{ to }16:00$), or drops by any amount at all during a morning rising quadrant ($04:00\text{ to }10:00$), secure your vessel or seek shelter immediately: a severe tropical disturbance is bearing down on your position.
5. Today's Meteorological Rule of Thumb
In the tropics, the barometer is a clock before it is a storm glass: if your pressure fails to climb between dawn and ten in the morning, or falls by more than one hectopascal beyond the natural afternoon slide, do not wait for the clouds—the atmosphere has already issued its storm warning.
Authoritative References and Further Reading
- For foundational hydrodynamic theory on atmospheric tides, consult the classical monographs documented on Atmospheric Tides via Wikipedia and the mathematical formulations of Laplace's Tidal Equations.
- For official international barometric monitoring protocols and isallobaric standards, explore the World Meteorological Organization (WMO).
- To study tropical cyclogenesis tracking and marine barometric forecasting guidelines, review educational resources provided by the National Oceanic and Atmospheric Administration (NOAA) and the National Hurricane Center.
- For upper-atmosphere wave propagation and stratospheric thermal dynamics, reference documentation from the UK Met Office.