Ltrace: Intercepting Dynamic Library Calls, Profiling Userspace Linkage, and Triaging Shared Object Latency in Production
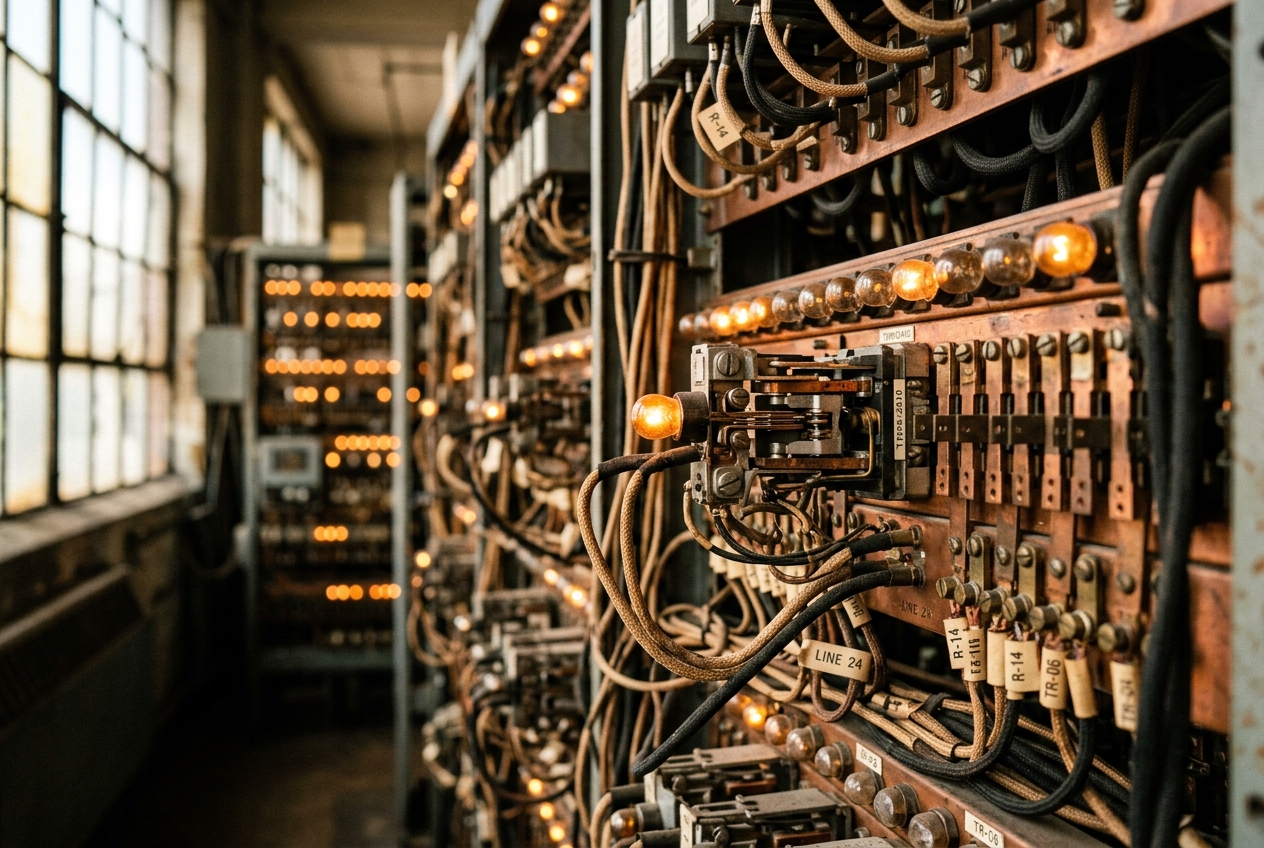
When you reach for standard diagnostics and attach strace(1) to the frozen worker processes, your terminal fills with an impenetrable, unhelpful wall of waiting locks. The operating system kernel is running flawlessly; the breakdown is occurring entirely in userspace, deep inside the closed-source proprietary binaries and dynamically linked libraries that hold the modern enterprise stack together.
In moments like this, kernel-level system call tracing is too coarse, while invasive source-level debuggers like GDB risk halting production traffic altogether. Systems engineers need a non-destructive diagnostic tool aimed squarely at the dynamic linking boundary. That tool is ltrace(1).
You can see the power of userspace library tracing in seconds. If you run a single command against a familiar tool like curl, you immediately expose every dynamic function call, memory pointer, and network latency figure hidden beneath the surface:
ltrace -s 64 -T curl -s https://example.com > /dev/null
getopt_long(4, 0x7ffd580b06b8, ":qksSt:m:M:N:o:O:p:P:r:R:u:U:v:V:w:W:x:X:z:Z:0:1:2:3:4:5:6:7:8:9", ...) = -1 <0.000015>
curl_global_init(3, 0x7f3b8b1a8000, 0x7f3b8b1a8000, 0)                   = 0 <0.000312>
curl_easy_init()                                                          = 0x55e2d14902b0 <0.000045>
curl_easy_setopt(0x55e2d14902b0, 10002, 0x7ffd580b2984, 0)               = 0 <0.000012>
curl_easy_perform(0x55e2d14902b0)                                         = 0 <0.045120>
curl_easy_cleanup(0x55e2d14902b0)                                         = 0x7f3b8b0e5000 <0.00118>
curl_global_cleanup()                                                     = 0x7ffd580b0600 <0.000085>
+++ exited (status 0) +++
In seven lines of output, you capture the entire lifecycle of the program: how command-line options were parsed, the memory address allocated for the transfer handle (0x55e2d14902b0), the arguments configured via libcurl.so, and the precise execution latency of the network dispatch (0.045120 seconds).
What It Does in Plain English
At its core, ltrace is a dynamic analysis utility that intercepts, records, and displays the userspace function calls made by a compiled program to shared libraries—such as libc.so, libssl.so, or libpq.so—alongside their arguments, return values, and execution times.
Think of your operating system as an international airport. The Linux kernel acts as air traffic control: managing runways, assigning gates, and regulating the airspace. Tracing tools like strace sit inside the control tower, monitoring every landing and takeoff request.
However, a great deal of business happens entirely inside the terminal buildings. Passengers purchase coffee, exchange currency, and pass through private security checkpoints without the control tower ever knowing. In software, these internal userspace interactions are handled by shared libraries. When an application prepares a database query, compresses a payload, or negotiates an encrypted TLS handshake, it does so within userspace. If one of those library routines gets stuck in an infinite string comparison or leaks memory, the kernel sees nothing amiss.
ltrace acts as a security camera placed directly in the terminal corridors. It catches the handoff between your application’s compiled machine code and external shared libraries, giving engineers instant visibility without needing source code or recompilation.
glibc, OpenSSL, libpq, libz"] end Libs -->|Issues System Call| Syscall["System Call Interface"] subgraph Kernel Layer Syscall -.->|strace intercepts here| STraceHook["strace Kernel Trap"] STraceHook --> Kernel["Linux Kernel Subsystems"] end
The Mechanics of Userspace Library Interception
To wield ltrace effectively in high-concurrency production environments, an engineer must understand the runtime architecture of dynamic linking on Linux, and why ltrace behaves differently from kernel tracers or modern eBPF probes.
1. Dynamic Linking, PLT, and GOT Mechanics
On modern Linux systems running the Executable and Linkable Format (ELF), dynamically linked binaries do not hardcode the physical memory addresses of external library functions at build time. Instead, symbol resolution is deferred to runtime via the dynamic linker, ld.so(8). This mechanism relies on two coordinated data structures:
- Procedure Linkage Table (PLT): A read-only executable code segment containing small trampoline stubs for every external function referenced by the binary.
- Global Offset Table (GOT): A dedicated data segment holding absolute memory addresses of resolved symbols.
Under lazy dynamic symbol binding, when an application invokes an external symbol like malloc() for the first time, a multi-stage lookup occurs:
- Execution branches to the stub at
malloc@plt. - The PLT stub reads the target address from its corresponding GOT entry (
malloc@got.plt). - On the first invocation, the GOT entry does not point to
libc.so; it points back to a dynamic linker resolver stub inside the PLT. - The resolver stub invokes
_dl_runtime_resolve()withinld.so, which locates the symbol in memory, overwritesmalloc@got.pltwith the real address, and calls the function. - All future calls jump straight from the PLT to the resolved GOT address, bypassing the dynamic linker.
2. How ltrace Hooks the PLT via ptrace
Unlike strace, which asks the Linux kernel to pause execution at every system call boundary, ltrace operates by actively modifying userspace memory instructions.
When ltrace attaches to a target process using ptrace(2), it parses the binary's ELF dynamic symbol tables (.dynsym, .rela.plt). For every function exported via the PLT, ltrace calculates the entry instruction address and uses PTRACE_POKETEXT to overwrite the first byte with a software breakpoint instruction (0xCC, representing INT 3 on x86_64 architectures).
When the application thread hits the modified PLT entry, the CPU raises a breakpoint trap (SIGTRAP). The kernel pauses the thread and hands control to ltrace. The tracer reads the processor registers conforming to the System V AMD64 ABI (extracting arguments from %rdi, %rsi, %rdx, %rcx, %r8, and %r9), formats the output, temporarily restores the original instruction to single-step past it, and puts the breakpoint back. To capture the return value, ltrace places a temporary breakpoint at the return address on the stack, reading the %rax register once the call finishes.
3. The Diagnostic Triad: Comparing Observability Tools
| Diagnostic Dimension | ltrace |
strace |
bpftrace / eBPF Uprobes |
|---|---|---|---|
| Interception Domain | Userspace Dynamic Linker (PLT/GOT) | Kernel System Call Interface | Kernel & Userspace (USDT, Uprobes) |
| Hooking Mechanism | ptrace software breakpoints (INT 3) |
PTRACE_SYSCALL event traps |
In-kernel eBPF VM hooked via uprobes |
| Context Switch Overhead | Extremely High (multiple switches per call + return) | High (Traps on kernel entry/exit) | Extremely Low (Kernel-executed BPF bytecode) |
| Target Visibility | Shared object symbol boundaries (.so) |
Kernel syscalls (sys_enter, sys_exit) |
Arbitrary memory addresses and internal symbols |
| Static Binary Support | None (requires dynamic linking / PLT) | Full (all binaries execute syscalls) | Full (requires symbol tables/debuginfo) |
| Primary Use Case | Library profiling, API auditing, string inspection | I/O analysis, signal tracing, resource blocks | Production-safe, low-overhead live profiling |
Core Flags & Quick Start
Before running ltrace against complex systems, familiarise yourself with its essential command-line flags:
-c: Computes an aggregate summary table of execution time, call counts, and errors per library call.-T: Records and displays the elapsed time spent inside each intercepted library call.-e <expr>: Filters output to include only specific library function names (supports glob patterns and symbol negation).-l <lib>: Restricts symbol interception exclusively to calls resolving to or originating from a named shared library (e.g.,libssl.so*).-p <pid>: Attaches non-destructively to an already running target process ID.-f: Follows and automatically attaches to child processes created viafork()orclone().-s <size>: Specifies the maximum string display length before truncation (defaults to 32 characters).-C: Automatically demangles low-level C++ symbols into human-readable class and function signatures.-S: Displays kernel system calls alongside userspace library calls for synchronized end-to-end tracing.
5 Real-World Production Use Cases
1. Profiling Aggregate Library Execution Time in Closed-Source Binaries
Scenario: An enterprise data ingestion daemon is pinning a CPU core at 100%, causing incoming message queues to overflow. The binary is proprietary, stripped of debug symbols, and offers no internal metrics. The engineering team must identify whether the bottleneck is string parsing, dynamic memory allocation, compression routines, or cryptographic hashing.
Command:
ltrace -c -T -f -p 4192
(Allow the profiler to collect samples for 15 seconds, then interrupt via Ctrl+C)
Terminal Output:
% time     seconds  usecs/call     calls      errors symbol
------ ----------- ----------- --------- ----------- --------------------
 58.42    8.421590         421     20000             deflate
 22.15    3.193210           1   3200000             strcmp
 11.04    1.591420           2    780000             memcpy
  5.12    0.738120           3    240000             malloc
  3.27    0.471410           2    240000             free
------ ----------- ----------- --------- ----------- --------------------
100.00   14.415750               4480000             total
Output Explanation:
* % time / seconds: Nearly 60% of total processing time is consumed by deflate from libz.so, racking up 8.42 seconds of pure CPU runtime during the capture window.
* usecs/call: Each individual compression invocation is computationally heavy, averaging 421 microseconds per call.
* strcmp: The daemon executed an astonishing 3.2 million string comparisons within 15 seconds, exposing an unindexed, quadratic lookup pattern across an in-memory string list.
Action Plan: The administrator modifies the daemon’s configuration file to reduce compression from level 9 to level 1, instantly recovering 50% of the host’s CPU capacity. They then submit an urgent bug report to the vendor requesting that the linear string lookup be replaced with a hashed dictionary.
2. Auditing Dynamic Memory Allocation Churn and Leak Signatures
Scenario: A background worker process slowly leaks memory over six hours until the Linux Out-Of-Memory (OOM) killer terminates it. Attaching Valgrind slows the application down by a factor of twenty—making it drop live streaming traffic—so the team must inspect memory allocations in a staging environment under real load.
Command:
ltrace -T -s 16 -e malloc+free+realloc+calloc -p 8812
Terminal Output:
malloc(4096)                                                              = 0x559e2b104a20 <0.000018>
malloc(64)                                                                = 0x559e2b105a30 <0.000009>
free(0x559e2b105a30)                                                      = <void> <0.000008>
malloc(4096)                                                              = 0x559e2b106a40 <0.000012>
malloc(64)                                                                = 0x559e2b107a50 <0.000007>
free(0x559e2b107a50)                                                      = <void> <0.000009>
malloc(4096)                                                              = 0x559e2b108a60 <0.000015>
calloc(1, 1024)                                                           = 0x559e2b109a70 <0.000021>
free(0x559e2b109a70)                                                      = <void> <0.000011>
Output Explanation:
* The application routinely allocates temporary 64-byte and 1024-byte tracking buffers (0x559e2b105a30, 0x559e2b109a70) and cleanly frees them microseconds later.
* Every processing iteration allocates a 4096-byte chunk (0x559e2b104a20, 0x559e2b106a40, 0x559e2b108a60).
* None of the 4096-byte buffers ever receive a matching free() call, creating a steady, upward climb in virtual memory usage.
Action Plan: Developers trace the recurring 4096-byte allocation to a network deserializer buffer that skips its cleanup logic whenever incoming packets fail a non-fatal checksum validation.
3. Intercepting Cryptographic and TLS API Workflows
Scenario: A microservice fails to establish Mutual TLS (mTLS) upstream connections to a banking clearance API. The application logs report only a generic Connection reset by peer, leaving engineers unsure whether the issue is an authentication rejection, an incompatible cipher suite, an expired client certificate, or a malformed SNI header.
Command:
ltrace -l /usr/lib/x86_64-linux-gnu/libssl.so* -e SSL_connect+SSL_read+SSL_write+SSL_get_error+SSL_shutdown -T -p 12044
Terminal Output:
SSL_connect(0x55c8e4a91c00)                                              = -1 <0.038112>
SSL_get_error(0x55c8e4a91c00, -1)                                         = 1 <0.000008>
ERR_get_error(0x55c8e4a91c00)                                             = 337047686 <0.000005>
ERR_error_string_n(337047686, "error:1416F086:SSL routines:tl"..., 256)   = 0x7fff328ba1b0 <0.000014>
SSL_shutdown(0x55c8e4a91c00)                                             = -1 <0.000120>
Output Explanation:
* SSL_connect() returns -1, indicating an unrecoverable failure during the TLS handshake negotiation.
* SSL_get_error() evaluates to 1, which corresponds to SSL_ERROR_SSL in the OpenSSL API Documentation, signifying a protocol-level failure within the library engine.
* ERR_error_string_n() unpacks error code 337047686 (0x1416F086), which translates directly to SSL_R_CERTIFICATE_VERIFY_FAILED.
Action Plan: The sysadmin inspects the local certificate store and discovers that an automated rotation script had updated the intermediate certificate authority without including the updated cross-signed root bundle. Refreshing the bundle resolves the TLS handshake immediately.
4. Tracing Database Client Shared Object Calls
Scenario: A Python service using compiled C-extensions for PostgreSQL access (libpq) experiences random thread lockups. Server-side database metrics indicate sub-millisecond execution times, but application workers freeze, pointing to a client-side connection pool contention or statement finalization bug.
Command:
ltrace -l libpq.so* -e PQconnectdb+PQexec+PQgetResult+PQclear+PQfinish -T -p 15631
Terminal Output:
PQconnectdb("dbname=billing host=10.0.4.12 user=service")                 = 0x55b14c33e210 <0.004210>
PQexec(0x55b14c33e210, "SELECT balance FROM accounts WHE"...)             = 0x55b14c348990 <0.000820>
PQclear(0x55b14c348990)                                                   = <void> <0.000009>
PQexec(0x55b14c33e210, "BEGIN TRANSACTION")                               = 0x55b14c349100 <0.000410>
PQexec(0x55b14c33e210, "UPDATE accounts SET balance = 50"...)             = 0x55b14c349a20 <0.000620>
PQgetResult(0x55b14c33e210)                                               = 0x0 <14.819201>
Output Explanation:
* The connection 0x55b14c33e210 initializes smoothly and dispatches standard transactional queries within fractions of a millisecond.
* After issuing an UPDATE, the client calls PQgetResult(), which blocks synchronously for nearly 15 seconds before returning NULL (0x0).
* The application invoked asynchronous query handling primitives (PQgetResult) on a synchronous connection handle that was already waiting on an uncommitted transaction from another worker thread.
Action Plan: The engineering team discovers that multiple concurrent asynchronous tasks were sharing a single non-thread-safe libpq connection handle rather than leasing dedicated handles from a thread-safe connection pool.
5. Auditing Environment Variable Resolution During Daemon Bootstrapping
Scenario: A newly containerized microservice crashes on startup inside a Kubernetes pod with an uninformative exit code 1. The application reads dozens of environment configurations, but developers cannot tell which required setting is missing or invalid.
Command:
ltrace -e getenv+secure_getenv+setenv+putenv -s 64 /usr/local/bin/payment-daemon --bootstrap
Terminal Output:
getenv("ENVIRONMENT")                                                     = "production"
getenv("PORT")                                                            = "8080"
getenv("DB_MAX_CONNECTIONS")                                              = "100"
getenv("VAULT_ADDR")                                                      = "https://vault.internal:8200"
secure_getenv("VAULT_TOKEN_PATH")                                         = NULL
getenv("FALLBACK_TOKEN_FILE")                                             = "/var/run/secrets/token"
getenv("TOKEN_ENCRYPTION_KEY")                                            = NULL
+++ exited (status 1) +++
Output Explanation:
* The binary looks up its configuration variables sequentially through standard glibc environment resolvers.
* secure_getenv("VAULT_TOKEN_PATH") returns NULL, prompting the process to check FALLBACK_TOKEN_FILE.
* Immediately following that fallback, getenv("TOKEN_ENCRYPTION_KEY") returns NULL, and the process aborts instantly without logging an explanation.
Action Plan: The engineer checks the deployment manifest and discovers a typo: the Kubernetes Secret was named TOKEN_ENCRYPT_KEY instead of TOKEN_ENCRYPTION_KEY. Fixing the key name in the Helm chart allows the pod to boot smoothly.
What Can Go Wrong: Operational Pitfalls & Overhead
Running ltrace against production workloads demands caution. Injecting software breakpoints directly into userspace memory carries real operational risks that must be managed.
Pitfall 1: Severe Latency Degradation and Cascading Outages
Because ltrace intercepts function calls via software breakpoints and signals, every intercepted library call forces multiple context switches between the target application, the Linux kernel, and the ltrace process. For tight loops executing millions of calls—such as memory allocators or string parsers—execution speed can degrade by 10x to 100x.
- The Danger: In high-traffic services, this artificial latency can cause health-check probes to fail, causing load balancers to eject healthy instances and triggering cascading failures across your cluster.
- Mitigation: Never attach an unfiltered
ltrace -pto a production service under active load. Remove the target instance from your load balancer pool first, or strictly scope your tracing using symbol filters (-e) or library filters (-l).
Pitfall 2: Incompatibility with Statically Linked Binaries
ltrace relies entirely on dynamic linking structures (the PLT).
- The Danger: Statically compiled binaries (such as standard Go applications, Rust services compiled with
musl-static, or C programs built withgcc -static) do not contain a PLT or dynamic symbol table. Runningltraceon them outputs nothing, which can mislead you into thinking the program is idle. - Mitigation: Verify dynamic linking before attaching by checking the binary with
readelf:bash readelf -d /path/to/binary | grep NEEDEDIf the binary is statically linked, use bpftrace with userspace probes (uprobes) or fall back to system call analysis withstrace.
Pitfall 3: Stripped Dynamic Sections and Inlined Functions
While ltrace does not require full DWARF debug symbols, it does require the dynamic symbol table (.dynsym). If a binary has had its dynamic section stripped, or if internal functions were inlined by compiler optimizations (-O3), those routines will never jump through the PLT and will remain invisible to ltrace.
Advanced Technique: Correlating Userspace and Kernel Space with -S
When troubleshooting complex latency issues, userspace calls only tell half the story. By passing the -S flag, ltrace interleaves userspace library functions and kernel system calls chronologically, letting you see exactly how higher-level APIs translate into operating system operations:
ltrace -S -e fopen+fread+fclose ./file_reader
fopen("config.json", "r")                                                 = 0x558a2d1022a0
SYS_openat(AT_FDCWD, "config.json", O_RDONLY|O_CLOEXEC, 00)               = 3
fread(0x7ffd98201a00, 1, 4096, 0x558a2d1022a0)                           = 1024
SYS_read(3, "{\n  \"service\": \"auth\",\n  \"ret"..., 4096)              = 1024
fclose(0x558a2d1022a0)                                                    = 0
SYS_close(3)                                                              = 0
Today's Takeaway
The boundary between an application and its dynamically linked shared libraries is one of the most critical yet least understood layers in modern systems troubleshooting. By intercepting this interface via the Procedure Linkage Table, ltrace turns opaque compiled binaries into open, observable systems.
Right now, open a terminal on your workstation and run ltrace -c -T curl -s https://www.google.com > /dev/null. Within five seconds, you will have a complete runtime profile showing exactly how much compute time your machine spends resolving DNS names in glibc, negotiating cryptography inside libssl, and processing network packets through libcurl.
Authoritative Technical References
- Linux Kernel ptrace(2) Interface — The low-level kernel process tracing facility.
- Dynamic Linker ld.so(8) Manual — Mechanics of shared library loading and lazy symbol resolution.
- GNU C Library Architecture & Reference — Standard dynamic symbols and system interfaces.
- Linux Kernel Uprobe Tracer Documentation — Userspace dynamic tracing via eBPF.
- ArchWiki Tracing and Dynamic Analysis Guide — Practical guides for dynamic symbol extraction and binary debugging.