Iperf3: Benchmarking Network Throughput, Profiling TCP Window Dynamics, and Diagnosing Packet Loss in Production
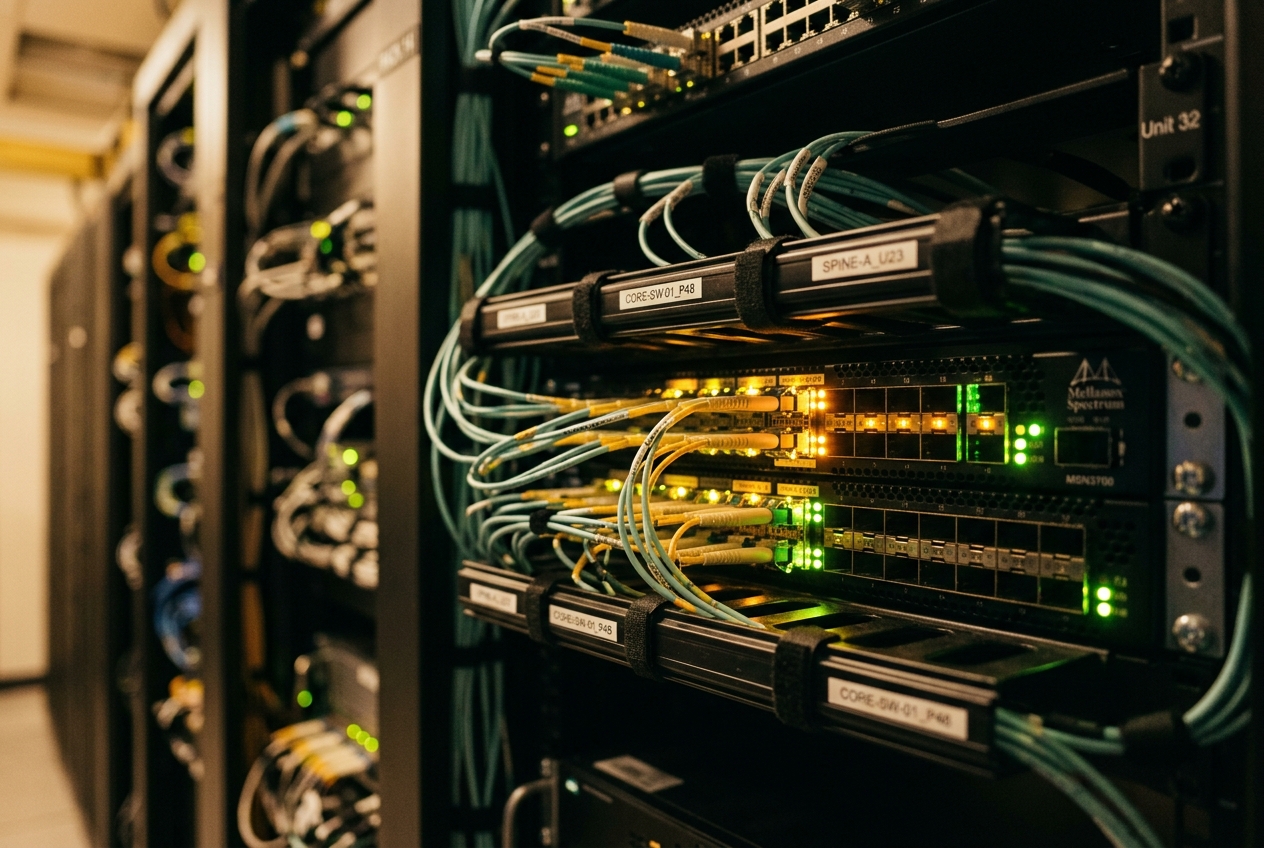
Everyone has an alibi, yet your production data is crawling through the pipes like cold molasses. In the fog of an active incident, debating theories is an expensive liability. You cannot trust application-level metrics alone because they are clouded by disk I/O, database locks, thread scheduling, and TLS negotiation overhead. You need an unvarnished, empirical measurement of what the underlying network transport path can physically deliver. This is where iperf3 becomes your most decisive diagnostic tool.
At its core, iperf3 is an active network benchmarking utility designed to measure the maximum achievable bandwidth between two endpoints. By spinning up a dedicated client-server architecture over TCP, UDP, or SCTP, it fires a controlled stream of synthetic traffic directly through the operating system's transport layer. Because it reads and writes purely from memory, it completely eliminates storage bottlenecks and application runtimes, isolating the raw performance of your physical and virtual network fabric.
The single most useful test you will ever run takes less than thirty seconds to execute. First, log into the remote destination machine—such as your database replica or application host—and start a lightweight listening daemon:
# On the remote destination host (10.0.1.10)
iperf3 -s
Next, from your local machine or source server, launch a standard ten-second TCP benchmark against that listener:
# On your local source host
iperf3 -c 10.0.1.10 -t 10
Connecting to host 10.0.1.10, port 5201
[  5] local 10.0.1.5 port 48290 connected to 10.0.1.10 port 5201
[ ID] Interval           Transfer     Bitrate         Retr  Cwnd
[  5]   0.00-1.00   sec   114 MBytes   956 Mbits/sec    0    389 KBytes
[  5]   1.00-2.00   sec   112 MBytes   941 Mbits/sec    0    412 KBytes
[  5]   2.00-3.00   sec   112 MBytes   942 Mbits/sec    0    412 KBytes
[  5]   3.00-4.00   sec   113 MBytes   945 Mbits/sec    0    412 KBytes
[  5]   4.00-5.00   sec   112 MBytes   942 Mbits/sec    0    412 KBytes
[  5]   5.00-6.00   sec   113 MBytes   945 Mbits/sec    0    412 KBytes
[  5]   6.00-7.00   sec   112 MBytes   942 Mbits/sec    0    412 KBytes
[  5]   7.00-8.00   sec   112 MBytes   941 Mbits/sec    0    412 KBytes
[  5]   8.00-9.00   sec   113 MBytes   945 Mbits/sec    0    412 KBytes
[  5]   9.00-10.00  sec   112 MBytes   942 Mbits/sec    0    412 KBytes
- - - - - - - - - - - - - - - - - - - - - - - - -
[ ID] Interval           Transfer     Bitrate         Retr
[  5]   0.00-10.00  sec  1.10 GBytes   946 Mbits/sec    0             sender
[  5]   0.00-10.04  sec  1.10 GBytes   942 Mbits/sec                  receiver

iperf Done.
In ten seconds, the mystery evaporates. If the output reports ~946 Mbits/sec with zero retransmits (Retr: 0) across a standard 1 Gbps link, the network transport is healthy, and you can immediately redirect the bridge call toward application thread contention or database lock queues. If it reports 42 Mbits/sec alongside hundreds of retransmissions, you have undeniable proof of a transport bottleneck.
Architectural Mechanics: How iperf3 Tests the Wire
Understanding how iperf3 operates within the Linux kernel is essential for making sense of diagnostic telemetry. When you run a test, iperf3 establishes a two-phase connection. First, a stateful control channel opens over TCP port 5201 to exchange test parameters, negotiate buffer profiles, and synchronize measurement clocks. Once agreed, dedicated data sockets are opened for high-speed transmission.
During the benchmark, the client continuously generates synthetic memory payloads via write() or send() system calls, pushing data into the kernel's transmission buffer (SO_SNDBUF). The Network Interface Card (NIC) pulls these descriptors via Direct Memory Access (DMA) and dispatches them across the physical wire. On the receiving host, incoming packets populate the socket receive buffer (SO_RCVBUF), where the iperf3 server drains them with continuous read() calls and tracks latency, packet loss, and throughput metrics.
Core Flags & Quick Reference
The power of iperf3 lies in its granular control over socket configurations, protocols, and stream concurrency. The most important operational flags include:
| Flag | Long Form | Operational Purpose |
|---|---|---|
-s |
--server |
Initializes the process in server mode, listening for control and data streams (default port: 5201). |
-c <host> |
--client <host> |
Initializes client mode, establishing a control channel to the target host before streaming traffic. |
-P <num> |
--parallel <num> |
Spawns multiple parallel streams over distinct ephemeral ports to overcome single-thread CPU or per-flow hash caps. |
-u |
--udp |
Shifts transport protocol from TCP to UDP to measure datagram jitter, packet loss, and reordering. |
-b <rate> |
--bandwidth <rate> |
Sets target transmission rate for UDP (default: 1 Mbps) or pacing rate for TCP (e.g. -b 10G, -b 500M). |
-w <size> |
--window <size> |
Overrides socket buffer sizing (SO_SNDBUF / SO_RCVBUF), setting the maximum TCP window. |
-C <algo> |
--congestion <algo> |
Selects the transport congestion control algorithm (e.g. cubic, bbr, reno) supported by the kernel. |
-R |
--reverse |
Inverts transmission direction; the server transmits synthetic data while the client acts as receiver. |
-J |
--json |
Emits structured JSON telemetry for automated parsing, CI/CD health checks, and log collection. |
-V |
--verbose |
Outputs extended diagnostics including CPU utilization, MSS negotiation, and socket buffer allocations. |
Transport Mechanics: Bandwidth-Delay Product and the Kernel
To analyze high-speed or long-distance network behavior, engineers must account for the Bandwidth-Delay Product (BDP). The BDP defines the volume of unacknowledged data that must remain "in flight" across the network to fully saturate the available bandwidth:
| Metric | Formula / Calculation | Operational Implication |
|---|---|---|
| Bandwidth-Delay Product | $\text{BDP} = \text{Capacity (bits/sec)} \times \text{Round-Trip Time (seconds)}$ | Defines the minimum buffer size needed to keep the physical pipe full. |
| Example: 10 Gbps Link with 40ms RTT | $(10 \times 10^9\text{ bps}) \times (0.040\text{ s}) = 400,000,000\text{ bits}$ | Requires a 50 MByte TCP window / socket buffer size to sustain full line rate. |
If the Linux socket buffer boundaries configured in tcp(7) (net.ipv4.tcp_wmem and net.ipv4.tcp_rmem) restrict the TCP window below the link's BDP, the sender will exhaust its unacknowledged transmission window and stall while waiting for return acknowledgments (ACKs), leaving expensive high-speed links drastically underutilized.
Furthermore, the host’s TCP Congestion Control Algorithm determines how the system reacts to latency and packet loss. Traditional loss-based algorithms like CUBIC treat any dropped packet as a sign of severe buffer congestion, slashing the transmission window in half. In contrast, modern model-based algorithms like BBR (Bottleneck Bandwidth and RTT) pace traffic against physical link limits, preventing throughput collapse across long-haul cloud routes as specified in RFC 7323.
5 Production Operational Scenarios
| Scenario | Diagnostic Scope | Primary Command Flags |
|---|---|---|
| 01. Multi-Gigabit Bonded Interfaces | Saturating 802.3ad LACP links across multiple hashing buckets | -P 8 -t 30 |
| 02. Real-Time Media Backbones | Diagnosing UDP jitter, packet loss, and out-of-order delivery | -u -b 1G -l 1400 |
| 03. High-Latency Cloud WANs | Tuning TCP window sizes and testing BBR congestion control | -w 4M -C bbr -V |
| 04. Asymmetric Firewall Bottlenecks | Triaging ingress vs egress security appliance throughput | -R -c <host> |
| 05. Automated Infrastructure CI/CD | Programmatic health validation and quality gating with JSON | -J --logfile <path> |
1. Saturating Multi-Gigabit Bonded Interfaces via Multi-Stream Parallelism
Enterprise database servers and distributed storage nodes frequently bond dual 10GbE or 25GbE interfaces using 802.3ad Link Aggregation (LACP). Single-stream benchmarks often appear capped at ~9.4 Gbps because a single TCP connection is bound to one hashing bucket and one CPU core interrupt queue. Spawning multiple parallel streams (-P 8) generates distinct port combinations, distributing traffic across all physical bond members and Receive Side Scaling (RSS) queues.
iperf3 -c 10.240.0.15 -P 8 -t 30
Connecting to host 10.240.0.15, port 5201
[  5] local 10.240.0.10 port 38920 connected to 10.240.0.15 port 5201
[  7] local 10.240.0.10 port 38922 connected to 10.240.0.15 port 5201
[  9] local 10.240.0.10 port 38924 connected to 10.240.0.15 port 5201
[ 11] local 10.240.0.10 port 38926 connected to 10.240.0.15 port 5201
[ 13] local 10.240.0.10 port 38928 connected to 10.240.0.15 port 5201
[ 15] local 10.240.0.10 port 38930 connected to 10.240.0.15 port 5201
[ 17] local 10.240.0.10 port 38932 connected to 10.240.0.15 port 5201
[ 19] local 10.240.0.10 port 38934 connected to 10.240.0.15 port 5201
[ ID] Interval           Transfer     Bitrate         Retr
[SUM]   0.00-30.00  sec  68.2 GBytes  19.5 Gbits/sec  142             sender
[SUM]   0.00-30.00  sec  68.1 GBytes  19.5 Gbits/sec                  receiver

[ ID] Interval           Transfer     Bitrate         Retr  Cwnd
[  5]   0.00-30.00  sec  8.53 GBytes  2.44 Gbits/sec   18   1.21 MBytes
[  7]   0.00-30.00  sec  8.51 GBytes  2.44 Gbits/sec   14   1.18 MBytes
[  9]   0.00-30.00  sec  8.54 GBytes  2.45 Gbits/sec   22   1.24 MBytes
[ 11]   0.00-30.00  sec  8.52 GBytes  2.44 Gbits/sec   19   1.19 MBytes
[ 13]   0.00-30.00  sec  8.53 GBytes  2.44 Gbits/sec   15   1.22 MBytes
[ 15]   0.00-30.00  sec  8.51 GBytes  2.44 Gbits/sec   20   1.17 MBytes
[ 17]   0.00-30.00  sec  8.52 GBytes  2.44 Gbits/sec   16   1.20 MBytes
[ 19]   0.00-30.00  sec  8.54 GBytes  2.45 Gbits/sec   18   1.23 MBytes
- - - - - - - - - - - - - - - - - - - - - - - - -
Analytical Breakdown
[ 5] ... [ 19]: Confirms eight separate transport streams running over distinct source ports (38920–38934), providing the entropy needed for network switch hashing algorithms.[SUM] 19.5 Gbits/sec: Confirms near-theoretical throughput across a dual-10GbE bonded interface (accounting for standard framing overheads).Retr: 142: Across 68.2 Gigabytes transferred, 142 packet retransmissions represent negligible micro-burst queuing drops (< 0.001%), well within healthy tolerances.
What the Admin Does Next
If single-stream tests remain capped at 9.4 Gbps while multi-stream tests hit 19.5 Gbps, inspect the kernel bonding policy with cat /sys/class/net/bond0/bonding/xmit_hash_policy. If configured as layer2, update the network configuration to layer3+4 so the bonding driver hashes Layer 4 TCP/UDP ports alongside IP and MAC addresses.
2. Diagnosing UDP Jitter, Packet Loss, and Datagram Reordering for Real-Time Media Backbones
Voice-over-IP (VoIP), video conferencing, and WebRTC streaming engines rely on UDP to prevent head-of-line blocking. Because UDP provides no inherent flow control or retransmission, tests must specify an explicit bandwidth ceiling (-b 1G) and constrain payload sizes (-l 1400) to avoid path MTU fragmentation.
iperf3 -u -c 198.51.100.22 -b 1G -l 1400 -t 20
Connecting to host 198.51.100.22, port 5201
[  5] local 203.0.113.14 port 54312 connected to 198.51.100.22 port 5201
[ ID] Interval           Transfer     Bitrate         Jitter    Lost/Total Datagrams
[  5]   0.00-1.00   sec   119 MBytes   1.00 Gbits/sec  0.032 ms  0/89285 (0%)
[  5]   1.00-2.00   sec   119 MBytes   1.00 Gbits/sec  0.041 ms  0/89286 (0%)
[  5]   2.00-3.00   sec   119 MBytes   1.00 Gbits/sec  0.038 ms  0/89285 (0%)
[  5]   3.00-4.00   sec   119 MBytes   1.00 Gbits/sec  1.420 ms  142/89286 (0.16%)
[  5]   4.00-5.00   sec   119 MBytes   1.00 Gbits/sec  3.891 ms  890/89285 (1%)
[  5]   5.00-6.00   sec   119 MBytes   1.00 Gbits/sec  0.082 ms  12/89286 (0.013%)
- - - - - - - - - - - - - - - - - - - - - - - - -
[ ID] Interval           Transfer     Bitrate         Jitter    Lost/Total Datagrams
[  5]   0.00-20.00  sec  2.33 GBytes  1.00 Gbits/sec  0.085 ms  1044/1785714 (0.058%)  sender
[  5]   0.00-20.04  sec  2.33 GBytes  1.00 Gbits/sec  0.091 ms  1044/1785714 (0.058%)  receiver
[  5] Out-of-order datagrams: 43
Analytical Breakdown
-l 1400: Sets the datagram payload size to 1,400 bytes, fitting safely inside standard 1,500-byte MTU envelopes after subtracting IP/UDP headers and VPN tunneling encapsulation.Jitter 3.891 ms at 4.00-5.00 sec: Highlights a transient delay variance spike, calculated per the statistical metric defined in RFC 3550.Lost/Total: 1044/1785714 (0.058%): Quantifies dropped packets. While 0.058% overall is modest, the concentrated 1% loss burst between seconds 4 and 5 will cause noticeable media stutter.Out-of-order datagrams: 43: Proves that packets are taking dynamic, multi-path ECMP routes through the network fabric and arriving out of sequence.
What the Admin Does Next
When jitter and packet loss surge together, inspect edge routers for bufferbloat. Switch active queue management from basic FIFO to Fair Queueing Controlled Delay (fq_codel) using tc qdisc add dev eth0 root fq_codel. If out-of-order packets persist, configure core routers to use flow-based symmetric hashing rather than per-packet round-robin routing.
3. Profiling TCP Window Scaling and Tuning Socket Buffers Across High-Latency Cloud WANs
Inter-region traffic (such as AWS us-east-1 to eu-central-1) often encounters round-trip latencies between 70ms and 110ms. On high-latency routes, default Linux socket buffer limits can throttle single-flow bandwidth. Testing with explicit window allocations (-w 4M), modern congestion control (-C bbr), and verbose output (-V) reveals transport scaling dynamics.
iperf3 -c 192.0.2.50 -w 4M -C bbr -V -t 30
iperf 3.9 (cJSON 1.7.13)
Linux prod-db-sync-01 5.15.0-1037-aws #41-Ubuntu SMP x86_64
Control connection to 192.0.2.50, port 5201
Socket TCP Congestion Control set to bbr
TCP window size: 8.00 MByte (WARNING: requested 4.00 MByte)
[  5] local 198.51.100.5 port 41298 connected to 192.0.2.50 port 5201
[ ID] Interval           Transfer     Bitrate         Retr  Cwnd
[  5]   0.00-5.00   sec  2.88 GBytes  4.95 Gbits/sec    0   3.92 MBytes
[  5]   5.00-10.00  sec  5.76 GBytes  9.90 Gbits/sec    0   7.84 MBytes
[  5]  10.00-15.00  sec  5.76 GBytes  9.90 Gbits/sec    0   7.84 MBytes
[  5]  15.00-20.00  sec  5.76 GBytes  9.90 Gbits/sec    0   7.84 MBytes
[  5]  20.00-25.00  sec  5.76 GBytes  9.90 Gbits/sec    0   7.84 MBytes
[  5]  25.00-30.00  sec  5.76 GBytes  9.90 Gbits/sec    0   7.84 MBytes
- - - - - - - - - - - - - - - - - - - - - - - - -
[ ID] Interval           Transfer     Bitrate         Retr
[  5]   0.00-30.00  sec  31.7 GBytes  9.07 Gbits/sec    0             sender
[  5]   0.00-30.08  sec  31.6 GBytes  9.04 Gbits/sec                  receiver

TCP Congestion Algorithm: bbr
CPU Utilization: local/sender 14.2% (0.8% user/13.4% system), remote/receiver 18.9% (1.1% user/17.8% system)
| Buffer Setting Parameter | Observed Behavior | Kernel Mechanism |
|---|---|---|
Requested Window (-w 4M) |
4.00 MBytes requested | Passed via setsockopt(SO_RCVBUF) |
| Allocated Window | 8.00 MBytes allocated | Linux automatically doubles requested socket memory to reserve 50% for internal sk_buff structures |
Analytical Breakdown
WARNING: requested 4.00 MByte: Demonstrates the Linux memory reservation model. The kernel doubles the requested value to guarantee sufficient memory overhead forsk_buffdescriptor management.-C bbr: Uses rate-based pacing to prevent the window collapses typical of loss-based algorithms likeCUBICon long-distance links.Cwnd: 7.84 MBytes: Matches the calculated Bandwidth-Delay Product, enabling the transfer to reach full 9.90 Gbps line speed by second 5.CPU Utilization: System time remains below 20%, confirming that the benchmark is not bottlenecked by CPU processing.
What the Admin Does Next
If cross-region throughput is bottlenecked by default window sizes, increase the system-wide limits in /etc/sysctl.conf:
net.core.rmem_max = 67108864
net.core.wmem_max = 67108864
net.ipv4.tcp_rmem = 4096 87380 67108864
net.ipv4.tcp_wmem = 4096 65536 67108864
net.ipv4.tcp_congestion_control = bbr
Run sysctl -p to apply these settings immediately. This enables the kernel's automatic TCP window scaling engine to handle large BDP flows without requiring per-command manual overrides.
4. Triaging Asymmetric Routing and Stateful Firewall Degradation via Reverse-Mode Transmissions
Corporate networks frequently exhibit routing asymmetry: outbound egress traffic travels directly through high-speed gateways, while inbound ingress traffic is routed through stateful packet inspection (SPI) firewalls or NAT appliances. Standard tests only measure the outbound client-to-server path. Running iperf3 in reverse mode (-R) flips the data direction over the established control socket, testing inbound performance without needing a shell on the remote server.
iperf3 -c 10.100.4.1 -R -t 20
Connecting to host 10.100.4.1, port 5201
Reverse mode, remote host 10.100.4.1 is sending
[  5] local 172.16.20.10 port 49182 connected to 10.100.4.1 port 5201
[ ID] Interval           Transfer     Bitrate         Retr
[  5]   0.00-1.00   sec  11.2 MBytes  93.8 Mbits/sec   84
[  5]   1.00-2.00   sec  10.8 MBytes  90.6 Mbits/sec   92
[  5]   2.00-3.00   sec  11.1 MBytes  93.1 Mbits/sec   78
[  5]   3.00-4.00   sec  10.9 MBytes  91.4 Mbits/sec   89
[  5]   4.00-5.00   sec  11.0 MBytes  92.3 Mbits/sec   95
- - - - - - - - - - - - - - - - - - - - - - - - -
[ ID] Interval           Transfer     Bitrate         Retr
[  5]   0.00-20.00  sec   218 MBytes  91.4 Mbits/sec  1840            sender
[  5]   0.00-20.02  sec   216 MBytes  90.6 Mbits/sec                  receiver

iperf Done.
Analytical Breakdown
Reverse mode, remote host is sending: The control channel stays anchored on port5201, but data streams from server (10.100.4.1) inbound to client (172.16.20.10).Bitrate 91.4 Mbits/sec with 1840 Retr: Pinpoints severe directional asymmetry. While forward outbound traffic achieved 1 Gbps, inbound reverse throughput collapsed by 90% alongside heavy retransmissions.- This pattern indicates middlebox firewall queue exhaustion, state-table bottlenecks, or MTU clamping mismatches on the return path.
What the Admin Does Next
- Check stateful firewall connection tables with
conntrack -Sto ensure connection tracking limits are not exhausted. - Verify MTU clamping rules on intermediary routers to ensure return-path packets are not being fragmented.
- Compare path routing symmetry using
traceroute --tcp -p 5201 10.100.4.1against a reverse trace from the server.
5. Automated Telemetry Integration in CI/CD and Bare-Metal Health Pipelines
Modern deployment pipelines require automated network validation before enrolling new bare-metal hosts or Kubernetes worker nodes into production clusters. Using the JSON output flag (-J) alongside --logfile allows deployment automation scripts to parse metrics and enforce strict quality gates.
iperf3 -c 10.50.0.100 -J --logfile /var/log/iperf3_run.json -t 15
{
    "start": {
        "connected": [{
            "socket": 5,
            "local_host": "10.50.0.10",
            "local_port": 58922,
            "remote_host": "10.50.0.100",
            "remote_port": 5201
        }],
        "version": "iperf 3.9",
        "system_info": "Linux k8s-worker-node-04 5.15.0-88-generic #98-Ubuntu SMP",
        "tcp_congestion_control": "cubic",
        "test_start": {
            "protocol": "TCP",
            "num_streams": 1,
            "blksize": 131072,
            "omit": 0,
            "duration": 15
        }
    },
    "end": {
        "sum_sent": {
            "start": 0,
            "end": 15.00012,
            "seconds": 15.00012,
            "bytes": 17568432128,
            "bits_per_second": 9369755480.95,
            "retransmits": 3,
            "sender": true
        },
        "sum_received": {
            "start": 0,
            "end": 15.00045,
            "seconds": 15.00045,
            "bytes": 17565810688,
            "bits_per_second": 9368142318.52,
            "sender": false
        },
        "cpu_utilization_percent": {
            "host_total": 8.42,
            "host_user": 0.45,
            "host_system": 7.97,
            "remote_total": 12.11,
            "remote_user": 0.82,
            "remote_system": 11.29
        }
    }
}
# Automated Validation via JQ Quality Gate
cat /var/log/iperf3_run.json | jq -e '
  .end.sum_received.bits_per_second as $bps |
  .end.sum_sent.retransmits as $retr |
  if ($bps >= 9000000000 and $retr < 50) then
    "PASSED: Throughput: \($bps / 1000000000 | round) Gbps, Retries: \($retr)"
  else
    "FAILED: Throughput: \($bps / 1000000000) Gbps, Retries: \($retr)" | halt_error(1)
  end'
Analytical Breakdown
end.sum_sent.bits_per_second: Provides high-precision measurement of sustained bandwidth ($9.369\text{ Gbps}$), making automated pass/fail threshold evaluation straightforward.end.sum_sent.retransmits: Delivers an objective health indicator; pipelines can fail node validation if retransmissions exceed acceptable thresholds.cpu_utilization_percent: Surfaces kernel context-switching load (host_system), identifying nodes suffering from missing hardware offloading (such as TSO/LRO).
What the Admin Does Next
Integrate this validation script into Ansible bootstrapping playbooks or ArgoCD pre-sync hooks. If a new node fails throughput or retransmission criteria, the pipeline automatically quarantines the instance and alerts engineering before customer traffic is routed to it.
Operational Pitfalls & Common Traps
| Danger Pattern | Root Cause | Operational Impact | Recommended Fix |
|---|---|---|---|
| Single-Thread Bottleneck | iperf3 event loop runs in a single process thread |
Plateaus at 20-30 Gbps on 40G/100G NICs | Bind multiple daemon instances across CPU cores using taskset |
| Manual Window Overrides | Hardcoding buffer size with -w flag |
Disables kernel dynamic auto-tuning | Avoid -w; tune system-wide sysctl tcp_rmem / tcp_wmem limits |
| Unthrottled UDP Floods | Running -u with -b 0 |
Floods link at full wire speed, dropping production packets | Always ramp UDP bandwidth targets incrementally (e.g. -b 100M, -b 1G) |
1. The Single-Threaded Bottleneck on 40GbE/100GbE Links
A common architectural trap on high-speed interfaces (40GbE and 100GbE) stems from iperf3's single-threaded event loop design. Even when running with multiple streams (-P 8), all streams are handled by a single CPU core.
- The Symptom: Throughput plateaus between 22 Gbps and 32 Gbps on a 100GbE interface, with top showing one CPU core pinned at 100% in software interrupts (
si). - The Fix: Launch multiple independent
iperf3daemons pinned to separate CPU cores withtaskset, as outlined in the ArchWiki: iperf Network Benchmarking guide:
# Server Host: Launch parallel daemons across distinct CPU cores and ports
taskset -c 0 iperf3 -s -p 5201 -D
taskset -c 1 iperf3 -s -p 5202 -D
taskset -c 2 iperf3 -s -p 5203 -D
taskset -c 3 iperf3 -s -p 5204 -D

# Client Host: Run coordinated parallel client tests
iperf3 -c 10.0.0.1 -p 5201 -t 30 &
iperf3 -c 10.0.0.1 -p 5202 -t 30 &
iperf3 -c 10.0.0.1 -p 5203 -t 30 &
iperf3 -c 10.0.0.1 -p 5204 -t 30 &
2. Manual Window Overrides Disabling Kernel Dynamic Auto-Tuning
Explicitly setting socket buffer sizes with -w triggers static setsockopt(SO_RCVBUF) calls. Under Linux, this freezes the buffer size and completely turns off the kernel’s dynamic TCP window auto-tuning engine (tcp_moderate_rcvbuf), as documented in the Linux kernel socket man page.
- The Risk: Setting a buffer that is too small limits throughput on high-latency paths; setting it too large across multiple streams risks memory exhaustion (
ENOMEM). - The Solution: Avoid setting
-win everyday testing. Allow the Linux kernel to dynamically adjust socket buffers within the global bounds set innet.ipv4.tcp_rmemandnet.ipv4.tcp_wmem.
3. Uncontrolled UDP Invocations Causing Outages
Running iperf3 -u -c <target> -b 0 removes all bandwidth rate-limiting, prompting the client to send UDP datagrams as fast as the local NIC can push them.
- The Risk: Unthrottled UDP streams can instantly saturate intermediate switch buffers, causing severe packet drops across co-located production applications sharing the same network uplinks.
- The Solution: Always ramp UDP tests incrementally from controlled baseline rates (e.g.
-b 100M,-b 500M,-b 1G) while monitoring switch interface drops.
Today's Takeaway
Network performance should never be a matter of guesswork or finger-pointing. Right now, you can baseline your own local machine in under five minutes: open two terminal tabs, run iperf3 -s in the first, and execute iperf3 -c 127.0.0.1 -V in the second. Watching the kernel's loopback interface report gigabytes per second, display socket window allocations, and log zero packet loss will give you an immediate, intuitive benchmark for how iperf3 isolates the transport layer before you take it into production.
Authoritative Documentation & Standards
- ESnet iperf3 Source Repository & Technical Manual
- Linux Kernel TCP Configuration Parameters — tcp(7)
- Linux Kernel Socket Subsystem Documentation — socket(7)
- ArchWiki: iperf Network Benchmarking
- RFC 7323: TCP Extensions for High Performance
- RFC 3550: RTP / Transport Layer Inter-Arrival Jitter Metrics