Tc: Shaping Network Bandwidth, Simulating Production Latency, and Enforcing Kernel Packet Scheduling
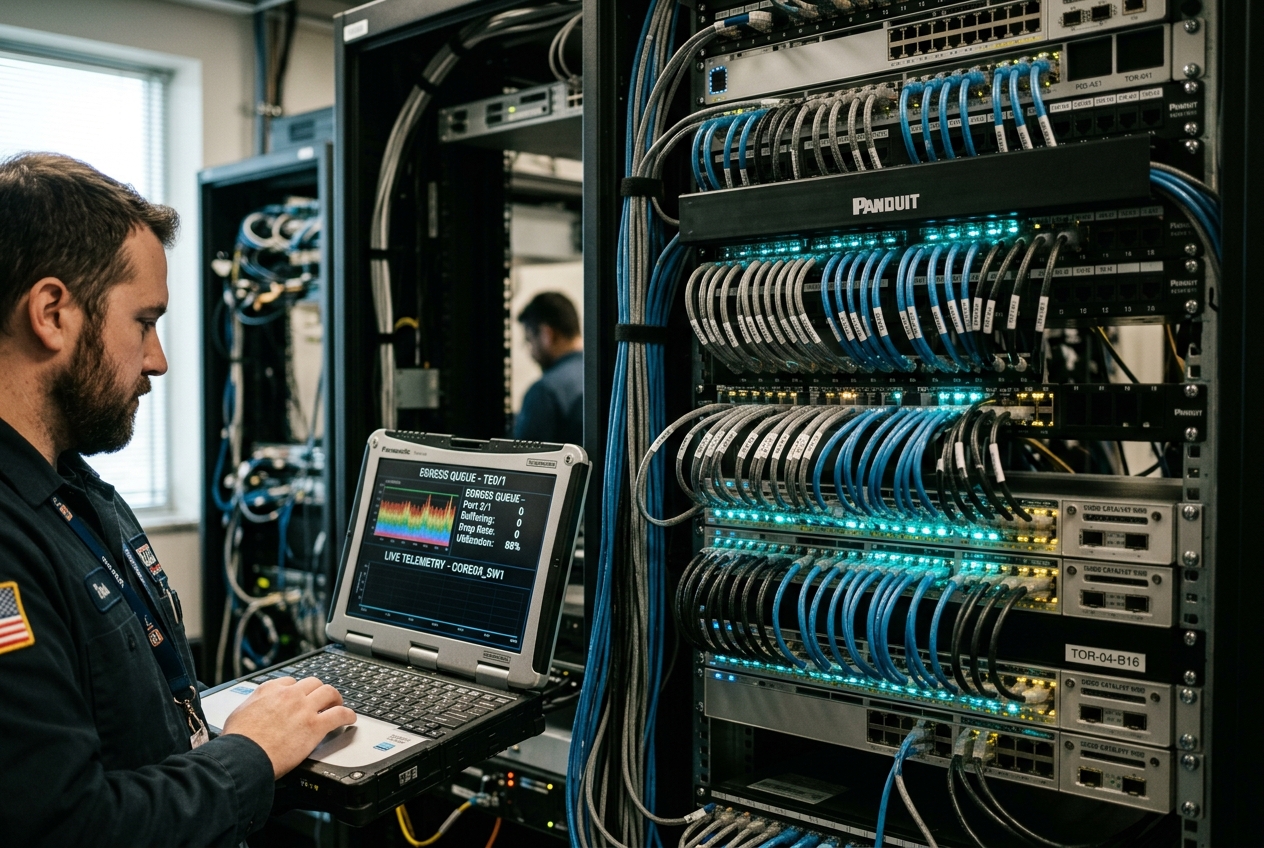
This baffling breakdown is a familiar nightmare for systems engineers: the invisible network chokehold. While average bandwidth looks comfortably low, sudden split-second floods of data from unthrottled background tasks—such as an automated database snapshot or a bulk backup script—are overwhelming the operating system's internal transmission queues. Like a convoy of heavy freight lorries blocking an entire motorway slip road, these transient microbursts trap critical heartbeats and user requests behind massive bulk payloads, inducing destructive latency without ever maxing out the total network connection.
Application code tweaks, server reboots, and thread-pool adjustments cannot resolve this crisis because the congestion is unfolding deep beneath user space, inside the kernel's packet dispatch machinery. The master key to diagnosing, controlling, and resolving this gridlock is the Linux kernel's built-in network traffic management utility: tc(8).
Before modifying configurations or restarting services during an incident, running a single diagnostic command immediately pulls back the curtain on active queue health, exposing whether outgoing packets are quietly queuing up, stalling, or being discarded before they ever hit the wire:
tc -s -d -p qdisc show dev eth0
qdisc fq_codel 0: root refcnt 2 limit 10240p flows 1024 quantum 1514 target 5ms interval 100ms ecn
 Sent 10845392024 bytes 7230261 pkt (dropped 142, overlimits 0 requeues 28)
 backlog 0b 0p requeues 28
  maxpacket 1514 drop_overlimit 0 new_flow_count 15204 ecn_mark 82
  new_flows_len 0 old_flows_len 12
This diagnostic output reveals the exact scheduling algorithm governing your interface, the size of internal memory buffers, the volume of actively tracked traffic flows, and whether packets are being intentionally dropped or marked with congestion flags to keep real-time latency under control.
WHAT TRAFFIC CONTROL DOES IN PLAIN ENGLISH
At its core, tc (Traffic Control) is the command-line control panel for the Linux kernel's internal packet scheduling, shaping, and queueing subsystems. When programs on your server generate data, they do not write directly to the physical network cable. Instead, they hand digital parcels (packets) to the operating system. Without traffic control, the operating system simply shoves these packets out the door as fast as the network card can accept them—a first-come, first-served free-for-all where massive, non-urgent file downloads can easily starve urgent database heartbeats or interactive keystrokes.
Traffic Control functions as an authoritative kernel-level traffic coordinator. It enforces deterministic policies dictating precisely when packets are dispatched, at what maximum speeds they may travel, which streams receive priority seating, and when low-priority traffic must wait in line. Beyond regulating production bandwidth and eliminating latency spikes, tc can also deliberately inject artificial network flaws—such as satellite-style delays, jittery connections, and random packet loss—allowing engineering teams to test the resilience of their distributed applications under harsh real-world conditions without leaving the staging environment.
THE KERNEL SCHEDULING ARCHITECTURE: QDISCS, CLASSES, AND FILTERS
To use tc effectively in production, it helps to picture the journey of a network packet through the Linux kernel. When an application transmits data over a socket, the kernel wraps that payload into an internal socket buffer structure (struct sk_buff) and passes it down through the TCP/IP stack. Before this buffer reaches the physical device driver's transmit ring (tx ring), it must pass through the Queueing Discipline (qdisc) subsystem.
The Traffic Control ecosystem is built upon three foundational abstractions:
- Queueing Disciplines (
qdisc): The core algorithms that govern how packet queues are buffered, prioritized, and released. Every network interface has a default root qdisc attached to its egress path (typicallypfifo_fastorfq_codelon contemporary Linux distributions). Qdiscs fall into two main families: * Classless Qdiscs: Algorithms that manage traffic uniformly without subdividing streams into child queues. Key examples include tc-tbf(8) (Token Bucket Filter for smooth rate limiting), tc-fq_codel(8) (Fair Queueing with Controlled Delay to eliminate bufferbloat), and tc-netem(8) (Network Emulator for resilience testing). * Classful Qdiscs: Schedulers that create hierarchical decision trees containing multiple logical traffic classes, allowing complex prioritization rules. Examples include Hierarchical Token Bucket (htb) and Multi-Band Priority (tc-prio(8)). - Classes: Logical child partitions inside a classful qdisc hierarchy. Each class has its own configured bandwidth allowances and queue boundaries, and can host attached child ("leaf") qdiscs. Classes are identified using a hexadecimal notation:
major:minor(for example,1:10). - Filters (Classifiers): The classification rules that inspect packet headers (IP addresses, port numbers, protocol types, or firewall tags) and steer matching packets into designated classes. The most ubiquitous native classifier is tc-u32(8), while modern cloud environments frequently leverage extended Berkeley Packet Filter (
eBPF) programs viatc-bpf.
Further in-depth architectural foundations and theory are detailed in the ArchWiki Advanced Traffic Control guide.
CORE FLAGS & QUICK-START DIAGNOSTIC TOOLKIT
Manipulating production network queues requires familiarity with the core command syntax and monitoring flags of the tc suite:
| Flag / Subcommand | Syntax Example | Operational Function |
|---|---|---|
qdisc add |
tc qdisc add dev eth0 root ... |
Attaches a new root or child queueing discipline to an interface. |
qdisc replace |
tc qdisc replace dev eth0 root ... |
Atomically replaces an existing qdisc without resetting the interface link state. |
qdisc del |
tc qdisc del dev eth0 root |
Removes all custom qdiscs on the interface, restoring kernel default queueing. |
class add |
tc class add dev eth0 parent 1: classid 1:1 ... |
Creates a child classification node inside a classful hierarchy. |
filter add |
tc filter add dev eth0 protocol ip ... |
Installs a classification rule mapping specific traffic into a target class. |
-s (--stats) |
tc -s qdisc show dev eth0 |
Displays runtime counters for transmitted bytes, packets, drops, and overlimits. |
-d (--details) |
tc -d qdisc show dev eth0 |
Displays internal algorithmic parameters (such as target latency and quantum size). |
-p (--pretty) |
tc -p qdisc show dev eth0 |
Formats output with clean indentation and human-readable time and size units. |
FIVE PRODUCTION-GRADE ENGINEERING RECIPES
1. Chaos Engineering: Injecting Calibrated Latency and Jitter via netem
Scenario
A microservice cluster experiences intermittent cascading timeouts across multi-region datacenters during peak trading hours. Before rolling out a major application update, you must verify that client retry budgets, circuit breakers, and gRPC deadlines hold up under real-world transatlantic WAN variance.
Command Syntax
tc qdisc replace dev eth0 root netem delay 85ms 15ms 25% distribution normal
Parameter Rationale
replace: Atomically applies the new rule, ensuring zero dropped connections or interface downtime for existing TCP sessions.root: Attaches the queueing discipline directly to the primary egress root ofeth0.netem: Invokes the Linux Network Emulator classless discipline.delay 85ms: Establishes a baseline artificial propagation delay of 85 milliseconds.15ms: Configures a jitter envelope of ±15 milliseconds.25%: Sets a mathematical correlation coefficient where the delay of packet N is 25% dependent on packet N-1, faithfully mimicking real-world physical transmission variations.distribution normal: Samples latency values from a realistic Gaussian bell curve rather than an artificial flat random distribution.
Terminal Output
tc -s qdisc show dev eth0
qdisc netem 8001: root refcnt 2 limit 1000 delay 85ms  15ms 25%
 Sent 2948201 bytes 1942 pkt (dropped 0, overlimits 0 requeues 0)
 backlog 65102b 43p requeues 0
Line-by-Line Breakdown
qdisc netem 8001: root: The kernel assigned an internal handle ID8001:to the active network emulator on the root interface.limit 1000: Netem enforces a maximum internal queue capacity of 1,000 packets before dropping subsequent arrivals.delay 85ms 15ms 25%: Confirms the active latency baseline, jitter range, and correlation factor.backlog 65102b 43p: Exactly 43 packets (totaling 65,102 bytes) are currently suspended in the kernel's internal timer wheel, waiting to be dispatched at the delayed time.
Next Steps for the Administrator
Execute an ICMP validation check (ping -c 50 <gateway-ip>) to confirm that round-trip times form a Gaussian distribution centered near 85ms. Observe your application telemetry to confirm that downstream circuit breakers trip gracefully when response times exceed their configured 100ms threshold.
2. Egress Rate Limiting: Throttling Bulk Database Backups via Token Bucket Filter (tbf)
Scenario
Nightly physical PostgreSQL database backups uploading to an Amazon S3 storage endpoint saturate the primary 10 Gbps production interface. This saturation starves synchronous API traffic, causing elevated HTTP 504 gateway timeouts. You need to strictly cap backup egress bandwidth at 50 Mbps without consuming excessive host CPU.
Command Syntax
tc qdisc replace dev eth0 root tbf rate 50mbit burst 32kbit latency 50ms
Parameter Rationale
tbf: Employs the Token Bucket Filter algorithm, which models bandwidth allocation via an internal bucket refilled with transmission tokens at a strict, continuous rate.rate 50mbit: Defines the maximum sustained outbound transfer rate (50 Megabits per second).burst 32kbit: Sets the token bucket size, allowing short microbursts at wire speed to prevent packet drops during initial TCP handshakes while respecting kernel timer boundaries.latency 50ms: Specifies the maximum time a packet is permitted to wait in the queue for new tokens before being discarded.
Terminal Output
tc -s qdisc show dev eth0
qdisc tbf 8002: root refcnt 2 rate 50Mbit burst 4Kb lat 50.0ms
 Sent 849302194 bytes 561230 pkt (dropped 1842, overlimits 412091 requeues 0)
 backlog 30280b 20p requeues 0
Line-by-Line Breakdown
rate 50Mbit burst 4Kb lat 50.0ms: Confirms the active rate limit and translated token bucket capacity (32 kbits = 4 Kilobytes).overlimits 412091: Indicates that 412,091 packets arrived to find an empty token bucket and were briefly held in queue memory.dropped 1842: Shows that 1,842 packets were discarded because their wait time exceeded the 50ms latency ceiling.backlog 30280b 20p: Exactly 20 packets are currently queued in memory waiting for token replenishment.
Next Steps for the Administrator
Run an active iperf3 -c <storage-endpoint> session to confirm throughput plateaus smoothly at 49.8–50.0 Mbps. Check the overlimits counter to ensure the buffer is absorbing bursts without triggering application socket resets.
3. Transit Degradation Simulation: Emulating Packet Loss and Reordering
Scenario
A distributed etcd cluster periodically suffers split-brain election instability across inter-datacenter links. You must determine the exact packet loss threshold and out-of-order delivery tolerance that breaks the cluster's Raft heartbeat mechanism.
Command Syntax
tc qdisc replace dev eth0 root netem loss 3.5% 25% reorder 12% 50% delay 20ms
Parameter Rationale
loss 3.5% 25%: Introduces a 3.5% drop probability with a 25% correlation factor, accurately modeling bursty loss patterns like physical fibre fades.reorder 12% 50%: Configures 12% of packets to be delivered ahead of sequence with a 50% correlation coefficient.delay 20ms: Required bynetemwhen performing reordering, establishing the time window needed to swap packet positions.
Terminal Output
tc -s qdisc show dev eth0
qdisc netem 8003: root refcnt 2 limit 1000 delay 20ms loss 3.5% 25% reorder 12% 50%
 Sent 14820194 bytes 9840 pkt (dropped 344, overlimits 0 requeues 0)
 backlog 15140b 10p requeues 0
Line-by-Line Breakdown
loss 3.5% 25%: Confirms active non-independent packet loss simulation.reorder 12% 50%: Confirms the kernel is actively scrambling packet sequence order.dropped 344: Shows that 344 packets were intentionally dropped by the kernel to meet the loss specification.
Next Steps for the Administrator
Monitor your distributed consensus metrics (such as etcd's raft_proposals_failed_total and etcd_server_leader_changes_seen_total) to calculate the exact resilience thresholds and tune heartbeat timeout configurations.
4. Bufferbloat Mitigation: Deploying Fair Queueing with Controlled Delay (fq_codel)
Scenario
A centralized edge gateway suffers severe latency spikes (climbing from 15ms to 800ms) whenever developers pull large container images or run CI transfers. The bulk TCP streams fill the interface buffers, producing severe bufferbloat that paralyzes interactive SSH sessions and VoIP streams.
Command Syntax
tc qdisc replace dev eth0 root fq_codel limit 10240 flows 1024 target 5ms interval 100ms quantum 1514 memory_limit 32Mb ecn
Parameter Rationale
fq_codel: Deploys the hybrid algorithm defined in IETF RFC 8290, combining Fair Queueing with Controlled Delay.limit 10240: Sets the global buffer ceiling to 10,240 packets across all active queues.flows 1024: Allocates 1,024 dynamic hash buckets to isolate individual network streams from one another.target 5ms: The acceptable buffer delay target. CoDel monitors standing queue latency and intervenes if delays persist above this limit.interval 100ms: The sliding observation window used to distinguish temporary bursts from persistent bufferbloat.quantum 1514: Sets the deficit round-robin byte allowance per dequeue round, matching standard Ethernet MTU.memory_limit 32Mb: Enforces an absolute memory ceiling to protect the kernel under extreme concurrency.ecn: Enables Explicit Congestion Notification, marking IP packet headers instead of dropping data when endpoints support ECN.
Terminal Output
tc -s -d qdisc show dev eth0
qdisc fq_codel 8004: root refcnt 2 limit 10240p flows 1024 quantum 1514 target 5.0ms interval 100.0ms memory_limit 32Mb ecn
 Sent 4819201948 bytes 3192041 pkt (dropped 89, overlimits 0 requeues 12)
 backlog 0b 0p requeues 12
  maxpacket 1514 drop_overlimit 0 new_flow_count 8140 ecn_mark 412
  new_flows_len 1 old_flows_len 3
Line-by-Line Breakdown
target 5.0ms interval 100.0ms: Confirms active CoDel latency tracking parameters.ecn_mark 412: The scheduler mitigated congestion for 412 packets by marking flags without dropping data.dropped 89: Only 89 non-ECN packets were dropped to signal senders to throttle their transmission rates.new_flows_len 1 old_flows_len 3: Four flows are active; interactive streams are automatically separated from bulk transfers, preserving low latency.
Next Steps for the Administrator
Run an active continuous ping alongside a multi-stream throughput benchmark (such as flent or speedtest-cli). Confirm that ping response times remain stable below 10ms even while the physical link runs at 100% capacity.
5. Multi-Tier QoS Prioritization: prio with u32 Protocol Classifiers
Scenario
On a multi-tenant node, automated telemetry collectors and heavy log forwarders compete with administrative SSH connections and business-critical DNS lookups. You must build a multi-tiered priority hierarchy where SSH and telemetry are serviced immediately, leaving remaining bandwidth to general workloads.
Command Syntax
# 1. Establish a 3-band Priority Root Queueing Discipline
tc qdisc replace dev eth0 root handle 1: prio bands 3 priomap 1 1 1 1 1 1 1 1 1 1 1 1 1 1 1 1

# 2. Attach Leaf fq_codel Schedulers to each Priority Band
tc qdisc replace dev eth0 parent 1:1 handle 10: fq_codel
tc qdisc replace dev eth0 parent 1:2 handle 20: fq_codel
tc qdisc replace dev eth0 parent 1:3 handle 30: fq_codel

# 3. Classify SSH Traffic (TCP Port 22) into Band 0 (Class 1:1 - Highest Priority)
tc filter add dev eth0 protocol ip parent 1: prio 1 u32 match ip protocol 6 0xff match ip dport 22 0xffff flowid 1:1

# 4. Classify Node Exporter Telemetry (TCP Port 9100) into Band 0 (Class 1:1)
tc filter add dev eth0 protocol ip parent 1: prio 1 u32 match ip protocol 6 0xff match ip sport 9100 0xffff flowid 1:1

# 5. Classify Standard Web Traffic (TCP Port 443) into Band 1 (Class 1:2 - Normal Priority)
tc filter add dev eth0 protocol ip parent 1: prio 2 u32 match ip protocol 6 0xff match ip dport 443 0xffff flowid 1:2
Parameter Rationale
prio bands 3: Creates three strict-priority classes:1:1(Band 0),1:2(Band 1), and1:3(Band 2). The kernel will never dequeue a packet from Band 1 if Band 0 contains a single packet.priomap 1 1 ...: Directs all unclassified traffic into Band 1 (Class1:2) by default.u32 match ip protocol 6 0xff: Matches the IP protocol field for TCP (value6) using a full 8-bit mask (0xff).match ip dport 22 0xffff: Matches destination port 22 using a 16-bit mask (0xffff).flowid 1:1: Directs matching packets to the highest priority class (1:1).
Terminal Output
tc -s class show dev eth0
class prio 1:1 parent 1:
 Sent 1049281 bytes 8124 pkt (dropped 0, overlimits 0 requeues 0)
 backlog 0b 0p requeues 0
class prio 1:2 parent 1:
 Sent 940192841 bytes 621094 pkt (dropped 12, overlimits 0 requeues 0)
 backlog 1514b 1p requeues 0
class prio 1:3 parent 1:
 Sent 18492018 bytes 12240 pkt (dropped 0, overlimits 0 requeues 0)
 backlog 0b 0p requeues 0
Line-by-Line Breakdown
class prio 1:1 parent 1:: Shows highest-priority statistics, confirming 8,124 SSH and telemetry packets dispatched with zero drops.class prio 1:2 parent 1:: Standard traffic class handling bulk payloads (940 MB) under active buffer management.backlog 1514b 1p: A standard packet is waiting in Band 1; if an SSH packet arrives, the kernel preempts it immediately.
Next Steps for the Administrator
Inspect active filter rules using tc -s filter show dev eth0. Run a heavy network transfer while typing in an SSH session to verify that terminal responsiveness remains crisp and lag-free.
AUDITING, FAILURE MODES, AND RECOVERY WORKFLOWS
Parsing Kernel Drop Counters and Overlimits
When inspecting output from tc -s qdisc show dev <interface>, administrators should track three critical indicators:
Sent 948201948 bytes 624102 pkt (dropped 1402, overlimits 82910 requeues 4)
dropped: The total count of packets discarded by the queue discipline. Intbf, this indicates packets whose queue wait time exceeded the configuredlatencyceiling. Infq_codel, it reflects deliberate early drops to keep queue latency low. In unmanaged FIFO queues, it indicates raw buffer overflow.overlimits: Incremented whenever a packet exceeds a configured rate limit envelope. Intbf, this counter increments whenever a packet arrives to an empty token bucket and is delayed. A risingoverlimitscount is normal in shaping disciplines; a risingdroppedcount signifies actual data loss.requeues: Occurs when the network interface card's hardware ring buffer is full, forcing the kernel to pull the packet back into software memory. High requeues indicate a mismatch between kernel dispatch speed and driver processing capability.
Pitfalls and Operational Traps
- The Ingress Blindspot: Traffic Control operates primarily on outgoing (egress) traffic. Shaping inbound (ingress) traffic directly is physically impossible because those packets have already traversed the physical medium and arrived in memory. To shape incoming traffic, administrators redirect ingress packets to an Intermediate Functional Block pseudo-device (
ifb0) via themirredaction filter, applying shaping policies to the virtual interface instead. - Timer Granularity and Burst Under-Sizing: On high-speed 10 Gbps+ connections, setting an overly small
burstparameter intbfwill choke throughput. Because Linux kernel timer resolution depends onCONFIG_HZandhrtimers, a token bucket that cannot hold at least one timer tick's worth of data at full line rate will throttle bandwidth far below the targetrate. - Destructive Deletion During Active Traffic: Running
tc qdisc del dev eth0 rootduring a traffic surge causes an abrupt fallback to the driver default queue, triggering an instant burst into the hardware ring that can momentarily drop connections. Always usetc qdisc replacefor safe, in-place operational changes.
The Clean Reset and Teardown Workflow
To safely remove all custom queueing disciplines, classes, and filters, returning the interface to its clean kernel defaults:
tc qdisc del dev eth0 root
Verify that the interface has returned to its default state:
tc qdisc show dev eth0
TODAY'S TAKEAWAY
Right now, open a terminal on your primary Linux system and run tc -s qdisc show. Inspect the output to discover whether your default egress queue is vulnerable to bufferbloat under load; if you observe an ancient pfifo_fast discipline or non-zero drop counters on unmanaged links, execute sudo tc qdisc replace dev $(ip route show default | awk '{print $5}') root fq_codel to instantly endow your network stack with modern, fair-queued, low-latency buffer management.