Du: Auditing Directory Space Consumption, Isolating Runaway Storage Footprints, and Triaging Filesystem Saturation in Production
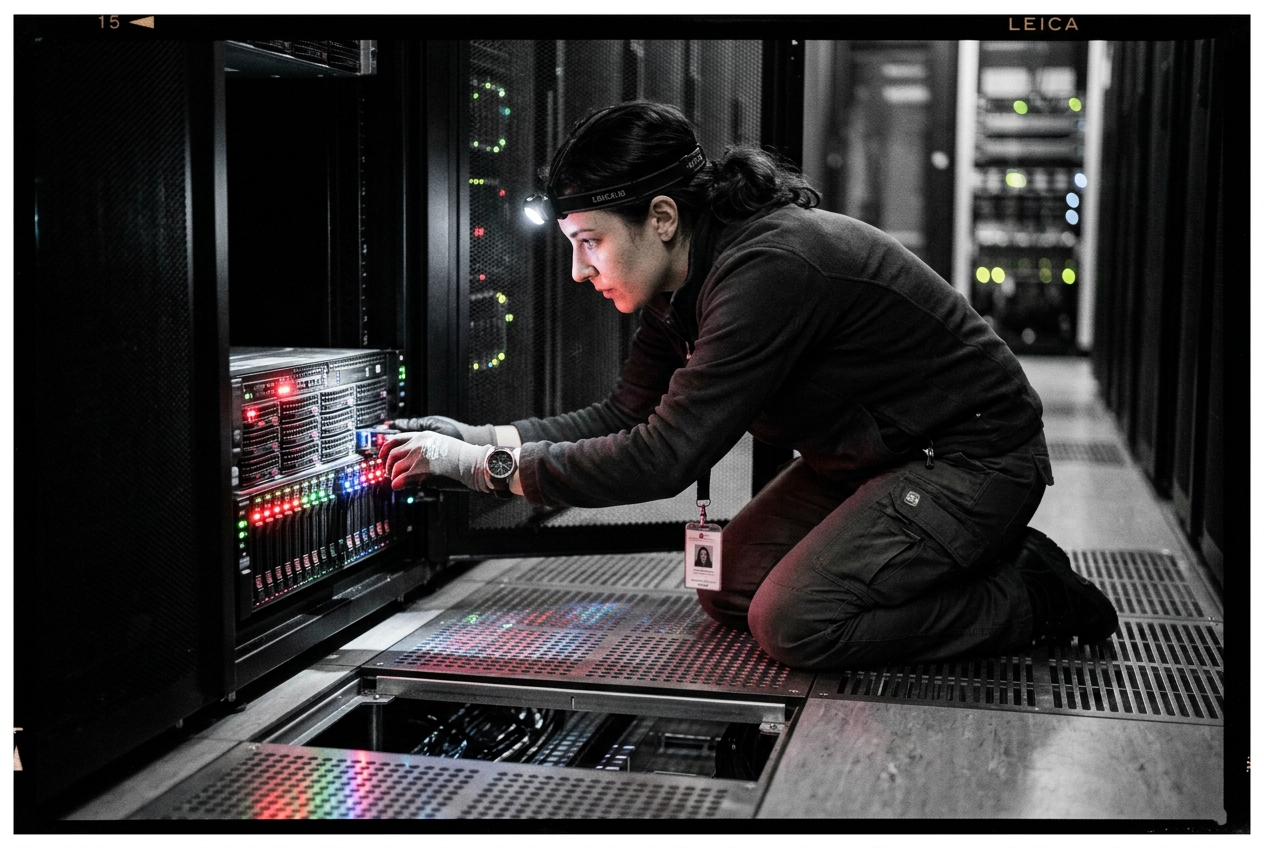
Connecting to the server over an emergency terminal connection reveals a system on the brink of complete paralysis. The shell refuses to autocomplete commands because it cannot write to its temporary history file. Audit logs are silently dropping, database writes are failing with fatal out-of-storage errors, and every service on the machine is suffocating. The server has run completely, catastrophically out of disk space.
In high-stakes moments like this, guessing where storage capacity has vanished is a recipe for downtime. Blindly deleting files can destroy critical databases or break operating system dependencies. Systems administrators need a swift, deterministic diagnostic tool that can traverse directory trees, measure physical disk allocations, and instantly pinpoint the exact culprit behind the outage. That foundational instrument is du (Disk Usage).
Before delving into the deeper mechanics of filesystem storage, here is the single most valuable triage command every engineer should keep within immediate reach:
du -hx --max-depth=1 / | sort -hr | head -n 15
This single command surveys the root directory, confines its search strictly to the local drive to avoid slow network mounts, scales the byte counters into human-readable gigabytes, and ranks the fifteen largest directory consumers. Within seconds, it tells the engineer whether the crisis is caused by an exploding log folder, an untamed container cache, or a runaway core dump.
What It Does in Plain English
At its core, du is a command-line tool that calculates and summarizes the actual storage space consumed by files, directories, and entire filesystem hierarchies. While standard file listing tools like ls report only the logical character length of individual files, du queries the underlying operating system to determine how much physical disk medium is actually occupied to store that data. By navigating through directories recursively, it provides systems administrators with an accurate, hierarchical breakdown of where storage capacity is being hoarded across the machine.
The Anatomy of Storage Telemetry: Foundational Mechanics
To wield du effectively during high-severity production outages, an engineer must understand the operating system mechanics that separate physical disk allocation from simple file indexing.
(du Command-Line Engine)"] -->|fstatat(2) / stat(2) System Calls| B["VFS & Inode Metadata Layer
(Reads struct stat)"] B --> C["Allocated Physical Blocks
(st_blocks * 512 Bytes)
Actual physical medium occupied"] B --> D["Apparent Logical Size
(st_size Bytes)
Length of byte stream / offset"]
System Call Architecture: stat(2) vs. Superblock Querying
The fundamental operational distinction in Unix storage telemetry lies between du and df (disk free). When an administrator executes df, the utility issues a statvfs(3) or statfs(2) system call directly against the target filesystem's superblock. This is an instantaneous, constant-time operation: the kernel immediately reads pre-calculated global counters maintained dynamically by the filesystem driver (such as ext4, XFS, or Btrfs). It yields immediate machine-wide visibility, but provides zero insight into which specific directory hierarchies are responsible for consuming that space.
Conversely, du operates as an exhaustive directory tree traversal engine governed by the POSIX IEEE Std 1003.1 specification. As it traverses the directory tree, it issues stat(2) or fstatat(2) system calls against every directory entry. Inside the returned struct stat metadata block, du inspects two critical, distinct fields:
struct stat {
    dev_t     st_dev;     /* ID of device containing file */
    ino_t     st_ino;     /* Inode number */
    off_t     st_size;    /* Total size, in bytes (Logical / Apparent Size) */
    blkcnt_t  st_blocks;  /* Number of 512B blocks allocated (Physical Disk Footprint) */
    blksize_t st_blksize; /* Block size for filesystem I/O */
    /* ... additional temporal and permission attributes ... */
};
By default, GNU du calculates space consumption strictly by multiplying the allocated block count by standard 512-byte units:
$$\text{Disk Footprint} = \text{st_blocks} \times 512 \text{ bytes}$$
Because modern storage allocation occurs in filesystem-specific block clusters (typically 4,096 bytes on ext4 and XFS architectures), a file containing just one byte (st_size = 1) will still occupy an entire 4,096-byte filesystem block. The operating system kernel tracks this inside st_blocks as 8 sectors of 512 bytes each ($8 \times 512 = 4096$). Thus, du accurately reports $4.0\text{ KiB}$ of consumption, reflecting real physical media occupancy rather than nominal character counts.
The Divergence: Why df and du Disagree
During production troubleshooting, engineers frequently encounter a puzzling situation: df reports that the drive is 100% full, yet running du / accounts for only 40% of the storage space. This discrepancy typically stems from three distinct architectural factors:
- Unlinked Open File Descriptors (Deleted Files Held Open): When an automated log cleanup script or administrator deletes an active log file using
rm, the file's name is removed from the directory structure, making it invisible todu. However, if a running service (such as Nginx, MySQL, or Java) still holds an open file handle to that file, the Linux kernel refuses to free the physical disk space until the service closes the handle or terminates. Whileducannot see the file during its directory walk,dfcontinues to report those storage blocks as occupied. The holding processes can be located usinglsof +L1. - Mount Point Obscuration: If a secondary storage volume is mounted on top of a non-empty directory on the parent drive (for example, mounting a dedicated drive over
/var/lib/dockerwhile old images still sit on the underlying partition),duwill only traverse the mounted drive by default. The obscured files on the root partition remain hidden fromdu, yetdfcontinues to account for them on the root device. - Filesystem Metadata and Reserved Space: Modern enterprise filesystems reserve dedicated space for inode tables, filesystem journals, and emergency root-only reserve buffers (typically 5% of total capacity). These structures are tracked globally by
df, but because they do not exist as standard files or folders,ducannot walk them.
Apparent Size vs. Allocated Disk Footprint
Understanding sparse file allocations is essential when managing virtual machines, database tablespaces, and container images. A sparse file contains unallocated sections where empty zero bytes exist logically, but no physical blocks have been written to the underlying drive.
| Storage View | Structural Representation | Measured By | Reported Value |
|---|---|---|---|
| Logical View (Apparent Size) | Extent 0 (10 MB) + Unallocated Sparse Gap (230 MB) + Extent 1 (10 MB) | st_size via --apparent-size |
250 MB |
| Physical Storage (Allocated Footprint) | Extent 0 (10 MB) + Extent 1 (10 MB) | st_blocks * 512 (Default du) |
20 MB |
When inspecting a 250 GiB virtual machine disk image (disk.raw) that currently contains only 20 GiB of written guest operating system data:
* du -h disk.raw queries st_blocks and reports 20G.
* du -h --apparent-size disk.raw queries st_size and reports 250G.
Confusing these two metrics can lead to severe provisioning mistakes during migrations, system backups, or disaster recovery drills.
Core Flags & Quick Start
The GNU Coreutils du implementation provides an extensive suite of command switches designed for precision filtering and rapid analysis.
| Flag / Option | Operational Mechanics & Purpose |
|---|---|
-h, --human-readable |
Scales block allocations into binary human-readable units (K, M, G, T) using multiples of 1024. |
-x, --one-file-system |
Strictly prevents traversal from descending into directories residing on different filesystems or mount points. |
-d N, --max-depth=N |
Limits directory recursion to $N$ levels below the specified starting path. |
-a, --all |
Displays allocation metrics for individual files as well as aggregate directory summaries. |
-s, --summarize |
Suppresses directory tree recursion, outputting only the single total size for each argument. |
-c, --total |
Appends a grand total line representing the aggregate sum of all scanned targets. |
-S, --separate-dirs |
For any given directory, excludes the block allocations of nested subdirectories from its total. |
--apparent-size |
Forces calculations based on logical byte length (st_size) rather than physical allocated blocks. |
--inodes |
Modifies the calculation engine to tally inode counts instead of storage byte volumes. |
--threshold=SIZE |
Excludes entries smaller than SIZE (if positive) or larger than SIZE (if negative). |
--time |
Displays the timestamp of the most recent modification across any file within the directory tree. |
The Essential Baseline Diagnostic
For any engineer assessing an unfamiliar Linux system to perform an initial storage appraisal, the single most dependable baseline command is:
du -h --max-depth=1 /var
Expected Terminal Execution:
# du -h --max-depth=1 /var
48K     /var/tmp
1.2G    /var/cache
14M     /var/backups
3.8G    /var/lib
8.0K    /var/mail
24G     /var/log
4.0K    /var/opt
4.0K    /var/spool
29G     /var
Five Real-World Production Use Cases
| Scenario | Target Command Pipeline | Diagnostic Focus |
|---|---|---|
| Case 1: Root Drive Saturation | du -hx --max-depth=1 / \| sort -hr \| head -n 15 |
Fast containment without traversing slow network storage |
| Case 2: Sparse VM Disk Audits | du -h vs du -h --apparent-size |
Differentiates physical host disk usage from virtual guest limits |
| Case 3: Inode Table Exhaustion | du --inodes -S /var/spool \| sort -nr \| head -n 20 |
Isolates directories choked by millions of zero-byte files |
| Case 4: Container Log Auditing | du -h --time --threshold=500M /var/log/containers |
Filters background noise to spot active, multi-gigabyte log spikes |
| Case 5: Multi-Tenant Quota Scans | du -b --max-depth=2 /data/tenants \| awk ... |
Emits structured telemetry for automated monitoring pipelines |
Use Case 1: Rapid Root Filesystem Triage without Mount Traversal
The Operational Scenario
A mission-critical application server's root partition (/) has reached 99% capacity. The server also hosts several high-capacity network file shares under /mnt/data (holding over 80 TB of assets) along with kernel virtual filesystems (/proc, /sys, /dev). Running a generic recursive du against the root directory will immediately traverse the high-latency network shares, saturating network bandwidth, overloading system memory, and potentially taking hours to complete while the root partition remains locked.
The Command Pipeline
du -hx --max-depth=1 / | sort -hr | head -n 15
Realistic Terminal Output
# du -hx --max-depth=1 / | sort -hr | head -n 15
48G     /
32G     /var
11G     /usr
3.2G    /opt
1.8G    /root
412M    /etc
180M    /boot
16K     /lost+found
4.0K    /srv
4.0K    /mnt
4.0K    /media
0       /tmp
Detailed Line-by-Line Telemetry Analysis
du -hx --max-depth=1 /: The-hflag formats numbers into readable megabytes and gigabytes. The essential-x(--one-file-system) flag tellsduto check the device identifier of the starting path (/) and immediately skip any folder located on a different storage device. Network storage mounts (NFS/CIFS), container overlay volumes, and temporary memory filesystems are excluded.--max-depth=1limits the scan to top-level directories.sort -hr: Sorts the output stream numerically (-n) while taking human unit suffixes into account (-h), reversing the order (-r) to place the largest directories at the top.head -n 15: Keeps only the top 15 largest consumers.- The output instantly reveals that of the 48 GB consumed on the root partition,
/varaccounts for 32 GB, while/usrconsumes 11 GB.
The Next Administrative Action
The administrator immediately inspects the offending directory by running:
du -hx --max-depth=1 /var | sort -hr | head -n 10
This isolates whether /var/log or /var/lib/docker is the primary culprit, enabling targeted cleanup without touching network storage.
Use Case 2: Auditing Sparse Virtual Machine Images & Database Tablespaces
The Operational Scenario
An infrastructure engineer is planning the migration of multiple virtual machine hypervisors running database nodes. The local enterprise storage array indicates that physical capacity is nearly exhausted. However, storage records show that the virtual disks were provisioned as dynamic sparse files. The engineer must distinguish between the physical storage blocks currently occupied on the host and the virtual disk size seen by the guest operating system to prevent over-allocating the migration destination.
The Comparative Command Invocations
du -h /var/lib/libvirt/images/prod-db-disk.qcow2
du -h --apparent-size /var/lib/libvirt/images/prod-db-disk.qcow2
Realistic Terminal Output
# du -h /var/lib/libvirt/images/prod-db-disk.qcow2
18G     /var/lib/libvirt/images/prod-db-disk.qcow2

# du -h --apparent-size /var/lib/libvirt/images/prod-db-disk.qcow2
250G    /var/lib/libvirt/images/prod-db-disk.qcow2
Detailed Line-by-Line Telemetry Analysis
du -h: Evaluates physical storage commitment by querying the real filesystem blocks allocated to the file. The output confirms that the virtual disk image currently consumes exactly 18 GiB of real physical media on the host drive.du -h --apparent-size: Bypasses physical block measurements and displays the total logical stream length. The output shows that the guest operating system has been allocated a maximum virtual capacity of 250 GiB.- The 232 GiB difference represents unallocated sparse regions—empty zero blocks for which the host operating system has not committed physical storage space.
The Next Administrative Action
To perform block compaction prior to copying the image across the network, the engineer reclaims unallocated zero blocks using fallocate(1) or compresses the image with standard hypervisor utilities:
qemu-img convert -O qcow2 -c /var/lib/libvirt/images/prod-db-disk.qcow2 /var/lib/libvirt/images/prod-db-disk-compressed.qcow2
Use Case 3: Diagnosing Zero-Byte Inode Exhaustion Across Spools and Caches
The Operational Scenario
A mail transfer server and caching proxy abruptly fails with No space left on device errors. However, running df -h shows that the storage drive has 450 GiB of free physical capacity (82% available). A secondary check with df -i reveals the true bottleneck: the drive has reached 100% Inode Utilization with zero free inodes remaining. Millions of tiny micro-files (zero-byte lockfiles, deferred delivery notices, or session records) have completely exhausted the filesystem's metadata index table. Standard du commands reporting gigabytes are useless here.
The Command Pipeline
du --inodes -S /var/spool | sort -nr | head -n 20
Realistic Terminal Output
# du --inodes -S /var/spool | sort -nr | head -n 20
1420512 /var/spool/postfix/maildrop
892100  /var/spool/postfix/defer
120440  /var/spool/postfix/deferred
4512    /var/spool/postfix/active
302     /var/spool/cron/crontabs
48      /var/spool/cups
12      /var/spool/postfix/pid
1       /var/spool/postfix/corrupt
1       /var/spool/lpd
Detailed Line-by-Line Telemetry Analysis
--inodes: Switches the internal operational mode ofdu. Instead of calculating byte sizes, the tool counts the raw number of individual file entries and metadata structures across the directory tree.-S,--separate-dirs: A vital flag for pinpointing the exact offending directory. By default,durolls child directory metrics into the parent directory's total. With-S,duisolates each directory individually, reporting only the files residing directly inside that specific folder.sort -nr: Sorts the raw numeric inode counts in descending order.- The output conclusively demonstrates that
/var/spool/postfix/maildropalone contains 1,420,512 individual files, identifying the exact source of metadata exhaustion.
The Next Administrative Action
Standard shell deletion commands like rm -f * will fail with an Argument list too long error due to shell buffer limits. The engineer initiates a streaming deletion using find:
find /var/spool/postfix/maildrop -type f -delete
Once the backlog is cleared, the mail configuration is updated to reject invalid message envelopes earlier in the delivery pipeline.
Use Case 4: Isolating Massive Container Log Volumes with Modification Timestamps
The Operational Scenario
On a Kubernetes worker node hosting dozens of microservice containers, the ephemeral storage directory (/var/log/containers) is experiencing sudden, massive write spikes. The operations team needs to determine which specific containers are generating runaway logs, verify whether those files are actively being appended to, and filter out the thousands of standard, healthy log files that clutter diagnostic output.
The Command Pipeline
du -h --time --threshold=500M /var/log/containers
Realistic Terminal Output
# du -h --time --threshold=500M /var/log/containers
782M    2026-08-17 02:45  /var/log/containers/auth-service-7bbd8f-9x2pq_security-audit.log
1.4G    2026-08-17 03:12  /var/log/containers/payment-gateway-55cfb4-k8w1z_app-error.log
12G     2026-08-17 03:18  /var/log/containers/ingestion-worker-8f99d7-zz9pl_stdout.log
15G     2026-08-17 03:18  /var/log/containers
Detailed Line-by-Line Telemetry Analysis
-h: Converts storage calculations into standard human-readable units (M, G).--time: Reads the modification timestamp of the files and displays the date and time of the most recent write next to each entry.--threshold=500M: Applies an analytical filter.ducompletely ignores any file or directory smaller than 500 Megabytes, eliminating background noise from healthy container logs.- The output clearly shows that
ingestion-worker-8f99d7-zz9plhas generated an active 12 GiB log file whose last write occurred at03:18(coinciding directly with the alert).
The Next Administrative Action
The administrator safely truncates the active file in-place to free storage blocks immediately without breaking the container's open file descriptor:
: > /var/log/containers/ingestion-worker-8f99d7-zz9pl_stdout.log
The team then updates the container orchestration configuration to enforce strict log rotation policies (such as max-size: 50m) to prevent recurring spikes.
Use Case 5: Automated High-Performance Auditing Pipeline for Multi-Tenant Storage
The Operational Scenario
An organisation operates a shared storage volume mounted under /data/tenants that hosts hundreds of departmental project directories. The storage engineering team needs an automated compliance script that runs nightly, flags departments exceeding their 100 GiB storage limit, and emits structured log events directly into the enterprise monitoring system.
The Automated Shell & AWK Pipeline
du -b --max-depth=2 /data/tenants | awk -v limit=107374182400 '
$1 >= limit && $2 !~ /^\/data\/tenants$/ {
    gib = $1 / 1073741824;
    printf "STATUS=CRITICAL | TIMESTAMP=\"%s\" | TENANT_PATH=\"%s\" | ALLOCATED_BYTES=%d | USAGE_GIB=%.2f\n",
           strftime("%Y-%m-%dT%H:%M:%SZ", systime(), 1), $2, $1, gib;
}'
Realistic Terminal Output
STATUS=CRITICAL | TIMESTAMP="2026-08-17T03:19:02Z" | TENANT_PATH="/data/tenants/engineering/build-artifacts" | ALLOCATED_BYTES=142874102912 | USAGE_GIB=133.06
STATUS=CRITICAL | TIMESTAMP="2026-08-17T03:19:02Z" | TENANT_PATH="/data/tenants/analytics/raw-lake" | ALLOCATED_BYTES=892314589184 | USAGE_GIB=831.03
STATUS=CRITICAL | TIMESTAMP="2026-08-17T03:19:02Z" | TENANT_PATH="/data/tenants/marketing/video-render" | ALLOCATED_BYTES=219902325555 | USAGE_GIB=204.80
Detailed Line-by-Line Telemetry Analysis
du -b --max-depth=2 /data/tenants: The-bflag outputs exact, unrounded single-byte integers (--apparent-size --block-size=1). This is crucial for automation scripts to prevent rounding discrepancies.--max-depth=2scans tenant folders without wasting resources indexing deeper directory levels.awk -v limit=107374182400: Passes the 100 GiB threshold ($100 \times 1024^3$ bytes) as an input variable.$1 >= limit && $2 !~ /^\/data\/tenants$/: Filters for paths where the byte count meets or exceeds the threshold, ignoring the root directory path.gib = $1 / 1073741824: Converts the raw byte count into standard gigabyte values.printf ...: Formats the parsed metrics into clean, structured key-value log entries ready for log ingestors like Fluentd or Vector.
The Next Administrative Action
This pipeline is saved into a scheduled cron job (/etc/cron.hourly/tenant_quota_audit) that automatically dispatches warning notifications to department managers when storage limits are exceeded.
What Can Go Wrong: Operational Hazards and High-IOPS Pitfalls
Running du indiscriminately across production servers can introduce operational risks if filesystem mechanics are ignored.
| Operational Hazard | Root Technical Cause | Mitigation Strategy |
|---|---|---|
| Production I/O Starvation | Unconstrained directory traversal evicts active application working data from the kernel page cache | Throttle I/O and CPU scheduling: ionice -c 3 nice -n 19 du ... |
| System Hangs on Network Shares | Traversing high-latency or unresponsive network filesystems (NFS, CIFS) | Always enforce the -x flag or wrap the command in a timeout 30s guard |
Discrepancy Confusion (du vs df) |
Active processes retain open file descriptors for unlinked files | Use lsof +L1 to identify and safely signal holding processes |
1. Severe I/O Starvation and Cache Eviction
When du traverses millions of directory entries, it forces the operating system kernel to issue heavy random disk read operations to load directory metadata into the kernel cache. On high-throughput database servers, this can saturate disk bandwidth and displace active database pages from system memory, degrading application performance.
- Mitigation Protocol: Throttle the scan priority using
ionice(1)(idle disk scheduling) andnice(lowest CPU priority):bash ionice -c 3 nice -n 19 du -hx --max-depth=2 /
2. Network Filesystem Deadlocks and Indefinite Freezes
Running an unrestricted du -h / on a system with mounted network file shares (such as stale NFS mounts or cloud storage buckets) can cause the scan to freeze in an uninterruptible sleep state (D-state) if the remote storage becomes slow or unresponsive.
- Mitigation Protocol: Never run global directory scans without the
-x(--one-file-system) flag, or guard the command with a stricttimeout(1)wrapper:bash timeout 30s du -hx --max-depth=1 /
3. Hardlinks and Double-Counting Misunderstandings
When multiple hardlinks point to the same physical file on disk, running du across isolated subdirectories can cause confusion. By default, GNU du tracks unique file identifiers (inodes) and counts the allocated physical blocks of a given file only once upon first discovery. If an administrator measures separate subdirectories independently, the sum of those individual runs will often appear larger than the result of a single unified scan across the parent directory.
Today's Takeaway
To build immediate confidence with filesystem diagnostics, open a terminal on your machine right now and run the safest, most informative diagnostic pipeline in systems administration:
du -hx --max-depth=1 /var 2>/dev/null | sort -hr | head -n 10
Running this command reveals the exact storage footprint of your machine's dynamic data directory, while protecting your session from network filesystem slowdowns and discarding permission noise. Practising this command today ensures that when disk saturation occurs during an unexpected production incident, your diagnosis will be calm, swift, and accurate.
Authoritative References & Architectural Standards
- GNU Coreutils
duManual — Comprehensive GNU specification for all invocation arguments and formatting attributes. - Linux Kernel
stat(2)System Call Reference — Technical documentation definingstruct stat,st_blocks, and VFS metadata handling. - Linux Kernel
statvfs(3)Filesystem Information Manual — Core system documentation for superblock telemetry querying. - POSIX IEEE Std 1003.1
duSpecification — The international standard establishing baseline portable behavior for Unix disk usage utilities. - ArchWiki Storage Management and Filesystem Internals — In-depth architectural analysis of block allocations, sparse structures, and inode paradigms in modern Linux distributions.