Dynamic Pressure Perturbations & Supercell Splitting: How Non-Hydrostatic Vertical Pressure Gradients Steer Storm Propagation
1. Opening Scene: The Tension in the Field
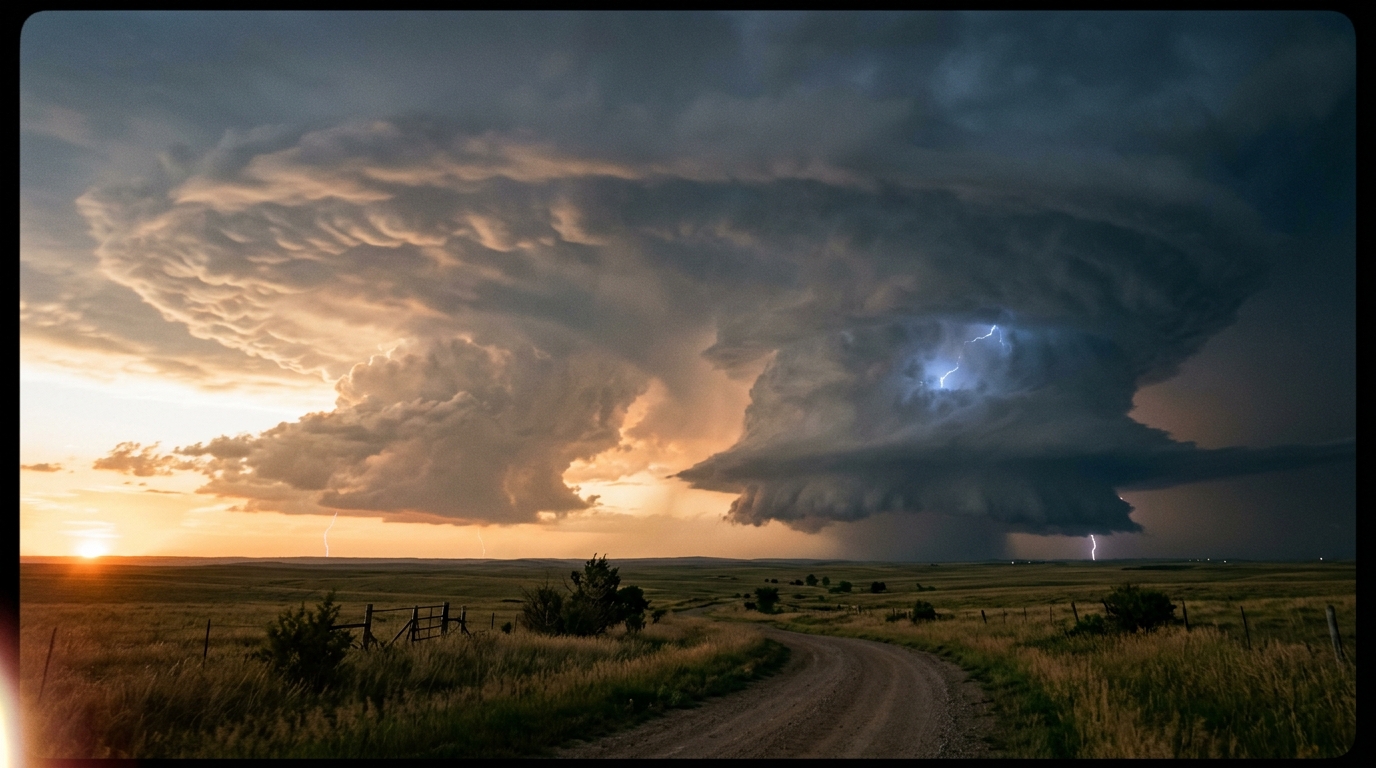
The afternoon air over the open plains does not simply grow warm; it thickens into a tangible, suffocating weight. By five o’clock, the breeze that rustled the dry prairie grasses at noon has vanished, replaced by an eerie, breathless stillness. The sunlight takes on an unearthly brass-and-ochre hue, filtered through the high, fibrous canopy of an anvil cloud spreading fifty thousand feet overhead. On the skin, the humidity registers as an insistent prickle, but the deeper sensation is one of falling weight—an imperceptible drop in the ambient barometric pressure that makes the ears feel subtly plugged, as though one were descending into deep water.
To the south-west, the horizon is dominated by a monolithic tower of cumulus congestus. It does not drift passively with the prevailing westerly winds; it boils violently upward, its cauliflower turrets expanding into the stratosphere at speeds exceeding fifty metres per second. Suddenly, the dead calm breaks. A cool, fragrant draught cuts through the stifling heat, carrying the sharp scent of petrichor and ozone—the crisp metallic tang of rain-chilled air sweeping across sun-baked soil.
Above the greening wheat fields, the base of the cloud darkens to a bruised indigo. Rather than raining out uniformly, the massive storm appears to breathe in the surrounding landscape. Tattered scud clouds race along the deck from the east, drawn horizontally into the storm’s base like smoke down a chimney flue. Overhead, the cloud base begins to sculpt itself: smooth, laminar terraces form, rotating steadily about a vertical axis. The observer on the ground feels an instinctive realization that thermal buoyancy alone cannot explain the sheer mechanical violence of this engine. Invisible dynamic forces are carving channels through the fluid sky, pulling air upward with the strength of a colossal centrifugal pump.
2. What's Actually Happening — Plain English First
To understand the ferocious power of a severe convective storm, meteorologists look far beyond simple hot air rising. We are taught in introductory physics that warm air rises because it is less dense than the cold air around it—a process governed by thermal buoyancy, analogous to a cork bobbing to the surface of a swimming pool. If thunderstorms were driven solely by buoyancy, they would puff upward, dump their rain directly through their own updraft chimneys, and collapse within forty minutes under the weight of their own precipitation.
Yet supercell thunderstorms—the long-lived monsters that generate giant hail and destructive tornadoes—can sustain themselves for six, eight, or even twelve hours, marching across entire continents while turning sharply away from the prevailing wind direction. They survive because they harness dynamic perturbation pressure: localized regions of suction and compression generated entirely by fluid motion and vertical wind shear.
To build an intuition for dynamic pressure, consider three everyday fluid phenomena:
- The Teacup Whirlpool (Centrifugal Suction): When you stir a cup of tea briskly with a spoon, a depression forms at the centre of the liquid surface. The rapid rotation flings fluid outwards, creating a low-pressure core at the axis of the vortex. In a thunderstorm, whenever air spins rapidly—whether in a broad meso-cyclone or a tight tornado vortex—it creates an intense drop in pressure along its axis. This low-pressure zone acts as a vacuum cleaner, aggressively pulling air upward from below.
- The River Boulder (Fluid Deflection): Imagine a heavy wooden post planted in a fast-flowing river. Water rushing directly against the upstream face of the post decelerates and piles up, creating a zone of high pressure. Conversely, the water rushing past the flanks of the post must accelerate around the curves, creating localized drops in pressure on the sides. In the atmosphere, an intense thunderstorm updraft acts like a solid obstacle to the fast-moving upper-tropospheric winds. High pressure builds on the upwind side of the updraft, while dynamic low-pressure pockets develop along its flanks.
- The Atmospheric Layer Cake: The troposphere is rarely uniform; wind speed and wind direction change dramatically with height—a phenomenon known as vertical wind shear. Think of the atmosphere as a layered cake where each slice slides horizontally at a different speed and compass direction. When a rising updraft punches through these sliding layers, it tilts the horizontal roll vortices of the background shear into vertical spin, creating paired low-pressure zones that can split the storm in two and steer the pieces across the map.
3. The Science (For Those Who Want to Go Deeper)
To rigorously capture how fluid motion creates its own internal pressure field, we turn to the diagnostic equations of atmospheric fluid mechanics. By taking the mathematical divergence of the three-dimensional momentum equations under the anelastic or Boussinesq approximations, we can isolate non-hydrostatic pressure perturbations from simple hydrostatic weight.
3.1 Deconstructing the Diagnostic Pressure Poisson Equation
Let the total atmospheric pressure $p(\mathbf{x}, t)$ and density $\rho(\mathbf{x}, t)$ be decomposed into a hydrostatic, horizontally homogeneous base state denoted by overbars, and a local perturbation denoted by primes:
$$p(\mathbf{x}, t) = \bar{p}(z) + p'(\mathbf{x}, t)$$
$$\rho(\mathbf{x}, t) = \bar{\rho}(z) + \rho'(\mathbf{x}, t)$$
Under the standard Boussinesq approximation (where density variations are neglected except when coupled with gravity in the buoyancy term), the inviscid Navier-Stokes momentum equation is expressed as:
$$\frac{\partial \mathbf{u}}{\partial t} + (\mathbf{u} \cdot \nabla)\mathbf{u} = -\frac{1}{\rho_0}\nabla p' + B\mathbf{k}$$
where $\mathbf{u} = (u, v, w)$ is the three-dimensional velocity vector, $\rho_0$ is a constant reference density, $\mathbf{k}$ is the upward vertical unit vector, and $B = -g \frac{\rho'}{\rho_0} \approx g \left(\frac{\theta_v'}{\bar{\theta}_v} - q_L\right)$ represents the net thermal and condensate-loading buoyancy (with virtual potential temperature $\theta_v$ and liquid water loading $q_L$).
Taking the three-dimensional vector divergence ($\nabla \cdot$) of the momentum equation, and invoking the incompressibility constraint ($\nabla \cdot \mathbf{u} = 0$), the local time derivative $\frac{\partial}{\partial t}(\nabla \cdot \mathbf{u})$ vanishes identically. This yields the diagnostic Pressure Poisson Equation:
$$\nabla^2 p' = -\rho_0 \nabla \cdot (\mathbf{u} \cdot \nabla \mathbf{u}) + \frac{\partial (\rho_0 B)}{\partial z}$$
Because the Poisson differential operator $\nabla^2$ is linear, we can cleanly separate total perturbation pressure $p'$ into a buoyant perturbation pressure ($p'_b$) and a dynamic perturbation pressure ($p'_d$):
$$p' = p'_b + p'_d$$
$$\nabla^2 p'_b = \frac{\partial (\rho_0 B)}{\partial z}$$
$$\nabla^2 p'_d = -\rho_0 \nabla \cdot (\mathbf{u} \cdot \nabla \mathbf{u})$$
3.2 Dynamic Perturbation Pressure Decomposition
By expanding the velocity gradient tensor, the dynamic source term $-\rho_0 \nabla \cdot (\mathbf{u} \cdot \nabla \mathbf{u})$ can be partitioned into fluid deformation (strain rate tensor $S_{ij}$) and fluid spin (vorticity vector $\boldsymbol{\omega} = \nabla \times \mathbf{u}$):
$$\nabla^2 p'd = \frac{\rho_0}{2} |\boldsymbol{\omega}|^2 - \rho_0 |S{ij}|^2$$
where $|S_{ij}|^2 = \sum_{i,j} \left[\frac{1}{2}\left(\frac{\partial u_i}{\partial x_j} + \frac{\partial u_j}{\partial x_i}\right)\right]^2$ represents the square of the rate-of-strain tensor.
In a severe storm context, meteorologists further decompose the horizontal wind into the mean environmental background flow $\bar{\mathbf{u}}(z) = (\bar{u}(z), \bar{v}(z), 0)$ and storm-induced convective perturbations $\mathbf{u}' = (u', v', w')$. Substituting this into the dynamic Poisson equation yields two dominant terms:
$$\nabla^2 p'd \approx \underbrace{-2\rho_0 \left( \frac{d\bar{\mathbf{u}}}{dz} \cdot \nabla_h w' \right)}{\text{Linear Shear-Updraft Term}} - \underbrace{\rho_0 \left[ \left(\frac{\partial u'}{\partial x}\right)^2 + \left(\frac{\partial v'}{\partial y}\right)^2 + \left(\frac{\partial w'}{\partial z}\right)^2 + 2\left(\frac{\partial v'}{\partial x}\frac{\partial u'}{\partial y} + \frac{\partial w'}{\partial x}\frac{\partial u'}{\partial z} + \frac{\partial w'}{\partial y}\frac{\partial v'}{\partial z}\right) \right]}_{\text{Nonlinear Perturbation Term}}$$
Fundamental Inversion Property of the Poisson Operator:
For localized convective perturbations in an unbounded domain, the Poisson operator acts as a negative scalar multiplier: $\nabla^2 p' \sim -k^2 p'$, where $k$ is the characteristic spatial wavenumber of the storm. Therefore: $$\text{A positive source term } (\nabla^2 p' > 0) \implies \text{A dynamic LOW-pressure perturbation } (p' < 0)$$ $$\text{A negative source term } (\nabla^2 p' < 0) \implies \text{A dynamic HIGH-pressure perturbation } (p' > 0)$$
1. The Nonlinear Term (Fluid Spin vs. Deformation)
Wherever convective rotation dominates over strain—such as in the core of a mesocyclone or tornado vortex where vertical vorticity $\zeta = \frac{\partial v'}{\partial x} - \frac{\partial u'}{\partial y}$ is maximized—the term $\frac{\rho_0}{2}\zeta^2$ is strongly positive. Through the inverse Laplacian, this forces a localized dynamic low-pressure core ($p'_d < 0$). This is the cyclostrophic deficit that prevents centrifugal disruption and provides continuous non-hydrostatic vertical suction.
2. The Linear Shear-Updraft Interaction Term
Defining the environmental vertical wind shear vector as $\mathbf{S} = \frac{d\bar{\mathbf{u}}}{dz} = \left(\frac{d\bar{u}}{dz}, \frac{d\bar{v}}{dz}\right)$ and the horizontal gradient of vertical velocity as $\nabla_h w' = \left(\frac{\partial w'}{\partial x}, \frac{\partial w'}{\partial y}\right)$, the linear Poisson contribution is:
$$\nabla^2 p'_{d,\text{linear}} \approx -2\rho_0 \left( \mathbf{S} \cdot \nabla_h w' \right)$$
This elegant relationship shows that when the vertical wind shear vector points in the direction of increasing updraft strength ($\mathbf{S} \cdot \nabla_h w' > 0$), $\nabla^2 p'$ is negative, inducing a dynamic high pressure on the upshear flank. Conversely, on the downshear flank where updraft strength decreases along the shear vector ($\mathbf{S} \cdot \nabla_h w' < 0$), $\nabla^2 p'$ is positive, inducing a dynamic low pressure.
3.3 Rotunno-Klemp-Weisman (RKW) Storm-Splitting Dynamics
The seminal work of Rotunno and Klemp (1982) and Weisman and Klemp (1984) demonstrated how vertical wind shear governs whether a convective cell remains solitary, splits into symmetrical twins, or evolves into a long-lived, right-moving supercell.
Case A: Unidirectional (Straight-Line) Hodograph
Assume the environmental horizontal wind increases purely in speed along the $x$-axis with height without changing direction: $\bar{\mathbf{u}}(z) = (cz, 0, 0)$, where $c = \frac{d\bar{u}}{dz} > 0$. The environmental horizontal vorticity vector $\boldsymbol{\omega}_h$ is directed along the negative $y$-axis:
$$\boldsymbol{\omega}_h = \nabla \times \bar{\mathbf{u}} = \left(0, \frac{d\bar{u}}{dz}, 0\right) = (0, c, 0)$$
When an isolated convective updraft $w'(x,y,z)$ develops, it tilts these ambient vortex tubes into the vertical. The vertical vorticity tendency from vortex tilting is:
$$\frac{\partial \zeta}{\partial t} \approx \left(\boldsymbol{\omega}_h \cdot \nabla_h\right)w' = \frac{d\bar{u}}{dz}\frac{\partial w'}{\partial y} = c \frac{\partial w'}{\partial y}$$
- On the southern (right) flank of the updraft ($y < 0$), vertical velocity increases toward the north ($\partial w'/\partial y > 0$), producing positive (cyclonic) vertical vorticity ($\zeta > 0$).
- On the northern (left) flank of the updraft ($y > 0$), vertical velocity decreases toward the north ($\partial w'/\partial y < 0$), producing negative (anticyclonic) vertical vorticity ($\zeta < 0$).
Because the nonlinear dynamic pressure deficit depends on the square of vorticity ($\zeta^2$), both flanks experience identical dynamic pressure drops ($p'_d < 0$) at mid-levels. Meanwhile, precipitation loading collapses the central updraft core. The non-hydrostatic vertical perturbation pressure gradient force (VPGFF), defined as:
$$\text{VPGFF} = -\frac{1}{\rho_0}\frac{\partial p'_d}{\partial z}$$
is strongly positive (upward-directed) beneath the mid-level vortex cores on both flanks. This forces the single thunderstorm to split symmetrically into two mirror-image storms: a cyclonic right-mover and an anticyclonic left-mover, each propagating perpendicular to the shear vector.
Case B: Clockwise-Curved Hodograph (Veering Wind Profile)
In typical tornadic environments, the hodograph is not straight; the wind veers (turns clockwise) with height through the lowest 3 kilometres (e.g., south-easterly at the surface, southerly at 1 km, south-westerly at 3 km, and westerly at 6 km).
Let the shear vector rotate with height. In the lowest 1–2 km, the shear vector $\mathbf{S}{\text{low}}$ points toward the north-east, while in the mid-troposphere (3–6 km), the shear vector $\mathbf{S}{\text{mid}}$ points toward the east-north-east.
Applying the linear dynamic pressure relation $\nabla^2 p'_{d,\text{linear}} \approx -2\rho_0 (\mathbf{S} \cdot \nabla_h w')$ across altitude slices:
- At Low Levels (0–1.5 km): The shear vector $\mathbf{S}_{\text{low}}$ is directed toward the north/north-east. On the southern (right-rear) flank, the updraft gradient $\nabla_h w'$ points opposite to $\mathbf{S}$, which makes $\mathbf{S} \cdot \nabla_h w' < 0$. This induces a dynamic high-pressure perturbation aloft and a dynamic low-pressure perturbation near the surface flank.
- At Mid Levels (2–5 km): The interaction of the rotated shear vector creates an intense mid-level dynamic low-pressure centre precisely over the southern (right) flank.
Because dynamic pressure is high at low levels and low at mid-levels on the southern flank, the vertical dynamic pressure gradient is exceptionally steep:
$$-\frac{1}{\rho_0}\frac{\partial p'_d}{\partial z} \gg 0 \quad \text{(Strong Upward Acceleration on the Right Flank)}$$
Conversely, on the northern (left) flank, the vertical dynamic pressure gradient is reversed ($-\frac{1}{\rho_0}\frac{\partial p'_d}{\partial z} < 0$), generating downward dynamic suppression. The left-moving cell is systematically starved of updraft mass flux and dissipates, while the right-moving cell is dynamically amplified, continuously propagating to the right of the mean tropospheric wind.
3.4 Worked Physical Example: Quantifying Dynamic Lifting
To appreciate why dynamic pressure is decisive in supercells, let us compute the vertical acceleration imparted by dynamic perturbation pressure versus pure thermal buoyancy in an operational scenario.
Scenario Parameters:
- Air reference density: $\rho_0 = 1.0\text{ kg m}^{-3}$
- Mean vertical shear across 0–6 km: $|\mathbf{S}| = \frac{\Delta \bar{u}}{\Delta z} = \frac{30\text{ m s}^{-1}}{6000\text{ m}} = 0.005\text{ s}^{-1}$
- Updraft core maximum: $w_0 = 40\text{ m s}^{-1}$
- Updraft horizontal radius: $R = 4000\text{ m}$
- Horizontal updraft gradient: $\frac{\partial w'}{\partial x} \approx \frac{w_0}{R} = \frac{40\text{ m s}^{-1}}{4000\text{ m}} = 0.01\text{ s}^{-1}$
- Mid-level vertical vorticity: $\zeta = 0.02\text{ s}^{-1}$ across a radius $r_v = 1500\text{ m}$
- Mid-level thermal perturbation: $\theta'_v = +3.0\text{ K}$ with $\bar{\theta}_v = 300\text{ K}$
Step 1: Calculate Pure Thermal Buoyant Acceleration ($a_{\text{buoy}}$)
$$a_{\text{buoy}} = g \frac{\theta'_v}{\bar{\theta}_v} = (9.81\text{ m s}^{-2}) \left(\frac{3.0\text{ K}}{300\text{ K}}\right) = 0.0981\text{ m s}^{-2} \approx 0.10\text{ m s}^{-2}$$
Step 2: Calculate Dynamic Low Pressure Deficit from Mid-Level Rotation ($p'_{d,\text{spin}}$)
Using the cyclostrophic scale formulation for a Rankine-like vortex core: $$\Delta p'_{d,\text{spin}} \approx -\rho_0 \left(\frac{\zeta \cdot r_v}{2}\right)^2 = -(1.0\text{ kg m}^{-3}) \left(\frac{0.02\text{ s}^{-1} \times 1500\text{ m}}{2}\right)^2 = -(1.0) \times (15)^2 = -225\text{ Pa} = -2.25\text{ hPa}$$
Step 3: Calculate Dynamic Linear Shear Perturbation Pressure ($\Delta p'_{d,\text{linear}}$)
Using the spatial scale relation $\nabla^2 p' \sim -\left(\frac{\pi}{R}\right)^2 p'$: $$-\left(\frac{\pi}{R}\right)^2 p'_{d,\text{linear}} \approx -2\rho_0 |\mathbf{S}| \frac{\partial w'}{\partial x}$$
$$p'_{d,\text{linear}} \approx 2\rho_0 |\mathbf{S}| \left(\frac{\partial w'}{\partial x}\right) \left(\frac{R}{\pi}\right)^2$$
$$p'_{d,\text{linear}} \approx 2(1.0)(0.005)(0.01)\left(\frac{4000}{\pi}\right)^2 = (0.0001) \times (1.621 \times 10^6) \approx 162.1\text{ Pa} = 1.62\text{ hPa}$$
Thus, between the left and right flanks, the dynamic linear pressure difference is $\approx 2 \times 1.62 = 3.24\text{ hPa}$.
Step 4: Calculate the Resulting Non-Hydrostatic Vertical Acceleration ($a_{\text{dynamic}}$)
If this mid-level dynamic low of $-2.25\text{ hPa}$ ($-225\text{ Pa}$) is established over a vertical depth of $\Delta z = 2000\text{ m}$ above the boundary layer:
$$a_{\text{dynamic}} = -\frac{1}{\rho_0}\frac{\Delta p'_d}{\Delta z} = -\frac{1}{1.0\text{ kg m}^{-3}} \left(\frac{-225\text{ Pa}}{2000\text{ m}}\right) = +0.1125\text{ m s}^{-2}$$
Key Insight:
The vertical acceleration produced purely by dynamic suction ($0.113\text{ m s}^{-2}$) exceeds the upward acceleration produced by a 3-Kelvin warm buoyancy anomaly ($0.098\text{ m s}^{-2}$). This demonstrates mathematically why supercells can force explosive updraft ascents through hostile, thermally stable capping inversions where regular air parcels cannot rise by buoyancy alone.
3.5 Radar Signatures of Dynamically Driven Convection
Operational meteorologists tracking severe storms on Doppler radar rely on specific structural signatures created directly by these dynamic pressure gradients:
| Radar Signature | Physical Mechanism | Dynamic Pressure Attribution |
|---|---|---|
| Bounded Weak Echo Region (BWER) | An echo-free vault penetrating deep into the storm’s core. | Upward non-hydrostatic VPGFF is so intense ($w > 40\text{ m s}^{-1}$) that hydrometeors are swept upward before they can grow to radar-reflective sizes. |
| Hook Echo (Reflectivity) | Cyclonic wrapping of precipitation around the southern flank. | Horizontal dynamic pressure gradient forces air and hydrometeors to orbit the mid-level cyclostrophic low. |
| Mesocyclone Velocity Couplet | Adjacent inbound and outbound Doppler velocity maxima ($ | \Delta V |
| V-Notch / Flying Eagle Pattern | Divergence of upper-level echo around the updraft summit. | Mid-to-upper tropospheric dynamic high pressure splitting oncoming ambient flow around the updraft cylinder. |
4. Practical Outdoor Guidance
While research meteorologists deploy supercomputers and dual-polarization radar networks to calculate dynamic perturbation pressures, an attentive observer on the ground can detect the signature of these invisible fluid forces using simple instruments and sharp visual awareness.
4.1 What to Look for in the Sky
- The Inflow Band ("Beaver Tail"): Look for a smooth, flat cloud band extending east or south-east from the main updraft base. Unlike turbulence-ragged scud, this band is laminar, indicating dense, moisture-laden boundary layer air being dynamically drawn into the low-pressure suction zone of the mesocyclone.
- Striated Cloud Formations ("Barber Pole" Structure): When dynamic pressure forces rotation throughout the depth of the updraft, the cloud perimeter exhibits corkscrew or barber-pole striations. These barrel-like horizontal rings mark the isobaric surfaces of the rotating dynamic column.
- Flank Preference and Deviant Motion: If a storm develops and rapidly splits into two distinct segments, observe their trajectories relative to the upper winds: - The left-mover will accelerate north-northeastward, frequently shedding heavy rain and rapidly dying out in environments with clockwise shear. - The right-mover will slow down, turn sharply south-eastward (to the right of the mid-level steering winds), and intensify. This rightward turn is the single most reliable visual indicator that dynamic perturbation pressure has taken control of the storm.
4.2 Instrument Readings to Monitor
If you are equipped with a field barometer, digital thermometer, and anemometer:
- The Barometric Trace: As a non-supercell thunderstorm approaches, the barometer typically spikes upward (the "thunderstorm bubble" or rain-cooled mesohigh). However, if an organized supercell approaches, the barometer will exhibit a sharp, distinct pre-storm dip (the mesolow) of 1.5 to 4.0 hPa immediately prior to the arrival of the gust front. This dip is the footprint of the mid-level dynamic vortex aloft.
- Surface Wind Direction: Watch for backed surface winds. If ambient regional winds are south-westerly, but surface winds within 15 km of the storm back to east-south-easterly and accelerate to 10–15 m/s without rain falling, the storm’s dynamic low is actively evacuating boundary layer air and augmenting its own low-level horizontal helicity.
4.3 Field Observer Safety Rules
- The Right-Mover Evasion Vector: When navigating relative to an established supercell, never position yourself to the north-east or east of the storm if it begins to turn right. Because dynamic pressure gradients force propagation to the right of the mean wind, right-moving supercells regularly intercept observers who attempt to "race ahead" along conventional downwind corridors.
- The Capping Inversion Rule: On warm spring days when weather models forecast a strong "cap" (a temperature inversion that prevents ordinary buoyant convection), monitor regional radar for isolated cells. If a cell successfully triggers, dynamic perturbation pressure can overcome negative buoyancy, producing a lone, exceptionally severe supercell that monopolizes all available atmospheric energy.
5. Today's Meteorological Rule of Thumb
The Golden Law of Storm Dynamics:
Thermal buoyancy may light the convective fuse, but dynamic pressure steers the fire: wherever strong environmental wind shear tilts into vertical rotation, invisible valleys of low pressure will dynamically hoist the storm, split its core, and drag its most dangerous flank relentlessly to the right.
Authoritative References & Further Reading
- NOAA Storm Prediction Center (SPC) — Comprehensive operational forecasting guides on supercell dynamics, environmental hodographs, and convective parameters.
- AMS Glossary of Meteorology: Dynamic Pressure — Definitive mathematical definitions and nomenclature for buoyant vs dynamic pressure perturbations.
- Met Office Thunderstorm Science Guide — Practical educational overviews of severe convective storm structures and shear interactions.
- NOAA National Severe Storms Laboratory (NSSL) — Cutting-edge research on Doppler radar signatures, tornadogenesis, and non-hydrostatic storm modelling.
- World Meteorological Organization (WMO) — Global standards and training modules on severe weather analysis and mesoscale atmospheric dynamics.
- Wikipedia: Supercell Dynamics — Overview of storm-splitting mechanics, RKW theory, and hodograph analysis.