Temperature Lapse Rates & Atmospheric Stability: Calculating Parcel Buoyancy for Field Weather Prediction
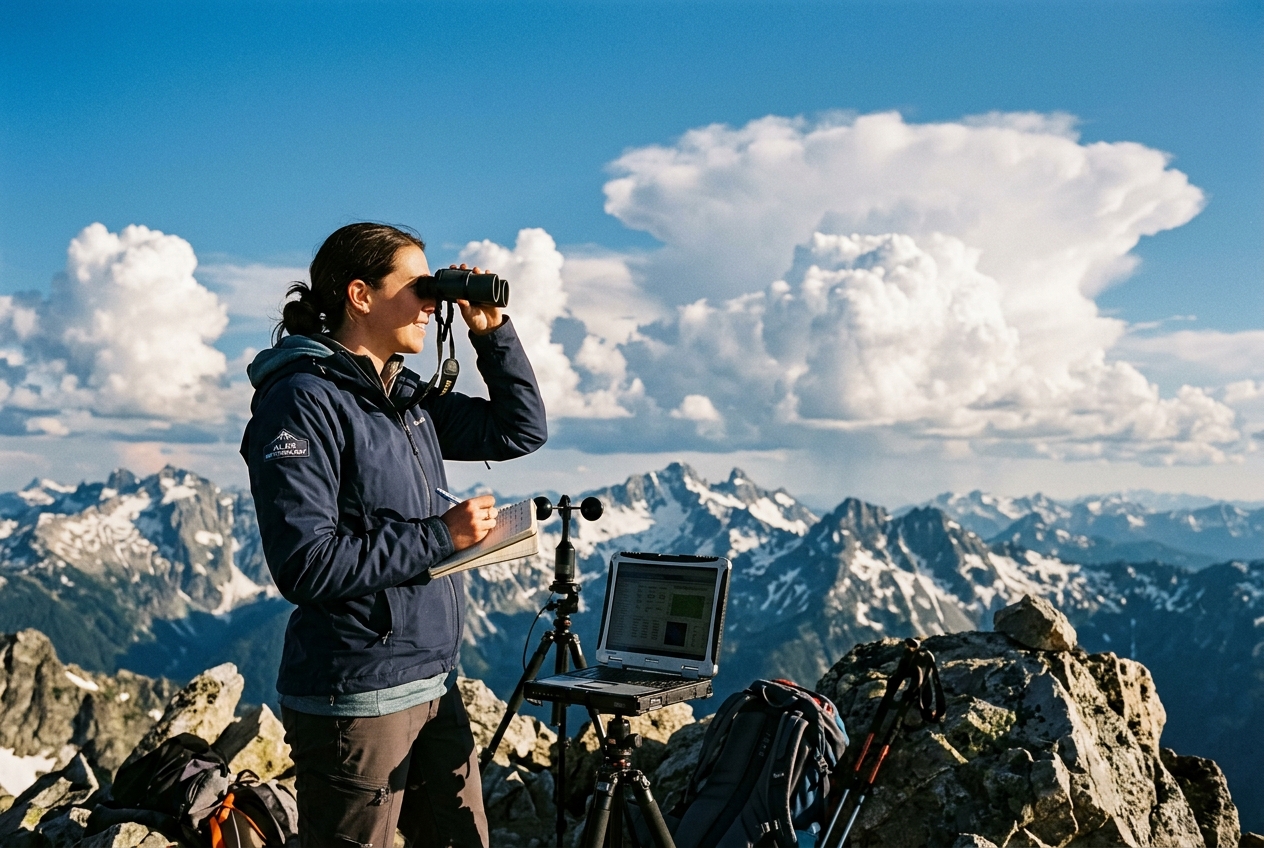
By Dr. Elena Vance & The Meteorological Research Unit
[!NOTE]
Executive Summary for Atmospheric Dynamics: Vertical air movement governs almost all severe weather on Earth. From the benign development of fair-weather cumulus to the explosive genesis of supercell cumulonimbus storms, atmospheric stability hinges upon the thermodynamic tug-of-war between the rate at which surrounding air cools with height (the Environmental Lapse Rate) and the rate at which an ascending air parcel cools through expansion (the Adiabatic Lapse Rates). This long-read chapter provides a comprehensive, mathematically accessible foundation for calculating stability indices, predicting cloud condensation levels, and reading cloud morphology in the field.
1. Outdoor Observer Field Notes: Reading the Sky and Sensing the Atmosphere
To stand at the foot of a mountain range on a humid midsummer morning is to witness a giant, invisible thermodynamic engine assembling its working fluids. To the untrained eye, the atmosphere appears uniform—an ocean of transparent gas stretching toward the blue vault of heaven. But to an outdoor observer attuned to the thermodynamic structure of the troposphere, every sensory input conveys critical data about atmospheric stability and vertical kinetic potential.
Consider a classic field scenario in the High Alps or the North American Rockies at 07:00 AM. The air at the valley floor is calm, cool, and crisp, smelling faintly of damp pine needles and earth. Looking upward, the sky is a deep, uninterrupted azure. As the sun climbs above the eastern ridgeline, intense solar radiation strikes the dark granite cliffs and mountain slopes. The ground absorbs this shortwave radiation, heating rapidly and warming the adjacent thin layer of air through conduction.
       07:00 AM - Morning Inversion                 14:00 PM - Deep Convection

     Altitude (m)                                 Altitude (m)
     3000 |------------------- (Cold Air)         3000 |--- ANVIL TOP (Tropopause) ---
          |                                            |     / / / / / / / / /
     2000 |--- INVERSION LAYER ---                2000 |    [ Cumulonimbus ]
          |   (Warm Air Lid)                           |    [  Towering    ]
     1000 |-------------------                    1000 |--- LCL (Cloud Base) -----------
          |   (Cool Valley Air)                        |   /   / Thermal Plume  \   \
        0 +-------------------                       0 +---------------------------------
            Valley Floor (Cool)                          Valley Floor (Intensely Heated)
By 10:30 AM, the observer notices the first physical transformations:
* Thermal Updrafts & Surface Pressure Drops: A subtle, erratic breeze begins to draw up the valley walls—an anabatic (upslope) wind. Barometric pressure at the valley station begins a steady, micro-barometric decline of 1.5 to 2.5 hPa over two hours.
* Haze Layer Cap & Breaking Inversion: Early in the morning, dust, smoke, and industrial aerosols were trapped beneath a clear boundary layer cap—a nocturnal temperature inversion. By mid-morning, as ground heating destabilizes this bottom layer, small, fuzzy turrets of haze burst upward through the inversion lid, signaling that convective thermals have breached the trapping ceiling.
* The First Cloud Base (Lifting Condensation Level): At exactly 11:15 AM, tiny white wisps of cloud abruptly materialize out of empty blue air at a uniform horizontal altitude across the entire mountain range. This flat line of cloud bases marks the exact altitude where rising dry air parcels have cooled to their dew point temperature—the Lifting Condensation Level (LCL).
* Morphological Evolution:
- If the atmosphere is stable above the cloud base, these clouds remain thin, flat, and sparse (Cumulus humilis), dissolving as quickly as they form.
- If the atmosphere is conditionally unstable, the clouds rapidly stack upward into billowy, cauliflower-like towers (Cumulus congestus).
- By 14:00 PM, if deep moisture and strong instability prevail, the tops of these towers freeze into fibrous ice-crystal anvils at 12,000 meters, spawning thunder, petrichor (the smell of geosmin released by rain striking warm soil), gust fronts (cool downdrafts rushing down from the storm core), and sudden, dramatic drops in surface air temperature.
Understanding whether a morning's clear sky will yield benign afternoon shade or dangerous cloud-to-ground lightning requires us to peer into the underlying physics of atmospheric expansion, latent heat release, and vertical pressure distribution.
2. Physical Principles & Intuitive Science: The Engine of Vertical Motion
The Idealized Air Parcel and Adiabatic Isolation
To model the complex, continuous fluid of the atmosphere, meteorologists use the theoretical concept of an air parcel: a non-mixing, flexible "balloon" of air roughly tens to hundreds of meters across.
When an air parcel rises, it experiences a drop in surrounding ambient atmospheric pressure. Because gases expand when external pressure decreases, the rising parcel pushes outward against its environment. Doing work on the surrounding atmosphere requires energy. Because air is a poor conductor of heat and atmospheric parcel ascents occur rapidly (over minutes to hours), the thermal energy transfer between the parcel and its surrounding environment via conduction or radiation is essentially zero ($dQ = 0$).
This process is strictly adiabatic. Consequently, the internal energy of the parcel must supply the work performed during expansion. As internal kinetic energy drops, the temperature of the rising air parcel decreases. Conversely, when an air parcel descends, higher ambient pressure compresses the parcel, performing work on it, which increases its internal kinetic energy and elevates its temperature.
                  PARCEL ASCENT (EXPANSION COOLING)

                  Higher Altitude -> Lower Ambient Pressure
                                ^
                                |
                         /-------------\
                        /               \  <-- Parcel Expands
                       |  Air Parcel     |     (Does Work on Environment)
                       |  dQ = 0         |     Internal Energy Drops
                        \               /      Temperature Decreases!
                         \-------------/
                                ^
                                |
                  Lower Altitude -> Higher Ambient Pressure
Hydrostatic Balance: Why the Atmosphere Doesn't Collapse or Fly Away
Why does atmospheric pressure decrease with altitude in the first place? The atmosphere is held against the planet by gravity while being supported against gravitational collapse by the upward directed pressure gradient force. This fundamental balance is known as hydrostatic equilibrium.
Consider a vertical column of air of cross-sectional area $A$ and height $dz$. The mass of the air within this elemental slice is:
$$dm = \rho \cdot A \cdot dz$$
where $\rho$ is the air density. The downward gravitational force acting on this mass is $dF_g = dm \cdot g = \rho g A dz$. For the slice to remain in static equilibrium, this downward weight must be perfectly counterbalanced by the difference between the higher pressure at the bottom face ($p$) and lower pressure at the top face ($p + dp$):
$$\Delta F_p = A \cdot p - A \cdot (p + dp) = -A \cdot dp$$
Setting the upward pressure force equal to the downward gravitational force:
$$-A \cdot dp = \rho g A dz \implies \frac{dp}{dz} = -\rho g$$
This is the Hydrostatic Equation. It dictates that atmospheric pressure must decrease monotonically with height at a rate proportional to air density and gravitational acceleration. For authoritative derivations and background on hydrostatic fluid balance, consult the MIT OpenCourseWare Atmospheric Thermodynamics Collection.
                 HYDROSTATIC BALANCE ON AN AIR SLICE

                          p + dp  (Top Pressure)
                        ↓ ↓ ↓ ↓ ↓
                    +---------------+  ---
                    |               |   ^
                    | Air Density ρ |   | dz
                    |               |   v
                    +---------------+  ---
                        ↑ ↑ ↑ ↑ ↑
                            p     (Bottom Pressure)

                 Upward Force: -A dp  =  Downward Weight: ρ g A dz
Latent Heat: The Atmospheric Turbocharger
Air carries water vapor—water in its gaseous phase. As a dry air parcel ascends and cools adiabatically, its ability to hold water vapor diminishes. The maximum amount of water vapor air can hold is governed by the Clausius-Clapeyron relation, which shows that saturation vapor pressure decreases exponentially with falling temperature.
When an ascending air parcel cools to its dew point, the air becomes saturated (relative humidity reaches 100%). Further ascent forces water vapor to condense into liquid water droplets. Phase change from gas to liquid releases energy—specifically, the latent heat of vaporization ($L_v \approx 2.5 \times 10^6 \text{ J/kg}$).
This released thermal energy directly heats the air parcel internally, offsetting a substantial fraction of the expansion cooling. As a result, once cloud droplets begin forming, a moist air parcel cools much more slowly during further ascent than a dry air parcel does. This distinction between dry adiabatic cooling and moist (saturated) adiabatic cooling is the single most vital engine driving atmospheric convection.
3. Accessible Mathematical Foundations: Quantifying Lapse Rates and Stability
To move from intuitive understanding to predictive field science, we must quantify three fundamental rates of temperature change with respect to altitude ($z$), known as lapse rates ($\Gamma = -\frac{dT}{dz}$):
- Environmental Lapse Rate (ELR): The actual measured temperature profile of the static atmosphere surrounding the parcel at any given time.
- Dry Adiabatic Lapse Rate (DALR): The rate at which an unsaturated air parcel cools as it moves vertically.
- Saturated Adiabatic Lapse Rate (SALR): The rate at which a saturated air parcel cools as it ascends while releasing latent heat.
Step-by-Step Mathematical Derivation of the Dry Adiabatic Lapse Rate (DALR)
Let us derive the exact numerical value of the DALR starting from first principles.
According to the First Law of Thermodynamics, the heat added to a system ($dq$) equals the change in internal energy ($du$) plus the work done by the system ($dw = p dv$):
$$dq = du + p dv$$
Using specific enthalpy ($h = u + pv$), we rewrite this in terms of specific heat capacity at constant pressure ($c_p$) and specific volume ($v = 1/\rho$):
$$dq = c_p dT - v dp$$
For an adiabatic process, no external heat is added or removed, so $dq = 0$:
$$c_p dT = v dp = \frac{1}{\rho} dp$$
Now, recall our Hydrostatic Equation: $dp = -\rho g dz$. Substituting this expression for $dp$ into our adiabatic equation gives:
$$c_p dT = \frac{1}{\rho} (-\rho g dz) = -g dz$$
Rearranging to isolate the vertical rate of temperature change ($\frac{dT}{dz}$):
$$\frac{dT}{dz} = -\frac{g}{c_p}$$
The Dry Adiabatic Lapse Rate ($\Gamma_d$) is defined as the negative of this vertical temperature gradient:
$$\Gamma_d = -\frac{dT}{dz} = \frac{g}{c_p}$$
Inserting standard terrestrial physical constants:
* Gravitational acceleration: $g = 9.80665 \text{ m/s}^2$
* Specific heat capacity of dry air at constant pressure: $c_p = 1004.67 \text{ J/(kg}\cdot\text{K)}$
$$\Gamma_d = \frac{9.80665 \text{ m/s}^2}{1004.67 \text{ J/(kg}\cdot\text{K)}} \approx 0.00976 \text{ K/m} = 9.76 \text{ K/km} \approx 9.8^\circ\text{C / 1,000 m}$$
Key Result: Unsaturated air ALWAYS cools at approximately 9.8°C per 1,000 meters (or 5.5°F per 1,000 feet) when rising, and warms at the exact same rate when descending. For further technical details, see the Wikipedia Reference on Atmospheric Lapse Rates.
The Saturated Adiabatic Lapse Rate (SALR) Formula
Once an air parcel reaches saturation, latent heat release counters expansion cooling. The mathematically exact expression for the Saturated Adiabatic Lapse Rate ($\Gamma_s$) is derived by incorporating the change in saturation mixing ratio ($dq_s$) into the energy balance equation:
$$\Gamma_s = \Gamma_d \left[ \frac{1 + \frac{L_v q_s}{R_d T}}{1 + \frac{L_v^2 q_s}{c_p R_v T^2}} \right]$$
Where:
* $L_v$ = Latent heat of vaporization of water ($\approx 2.5 \times 10^6 \text{ J/kg}$)
* $q_s$ = Saturation mixing ratio of water vapor (mass of vapor per mass of dry air, $\text{kg/kg}$)
* $R_d$ = Specific gas constant for dry air ($287.05 \text{ J/(kg}\cdot\text{K)}$)
* $R_v$ = Specific gas constant for water vapor ($461.5 \text{ J/(kg}\cdot\text{K)}$)
* $T$ = Absolute temperature in Kelvin ($\text{K}$)
Physical Intuition of the SALR Equation:
Because all terms inside the fraction bracket are positive, and the denominator increases faster with high water vapor content than the numerator, the term in brackets is always less than 1.0.
- In Warm, Tropical Air ($T = 30^\circ\text{C}, q_s \text{ high}$): Abundant water vapor condenses, releasing vast amounts of latent heat. Thus, $\Gamma_s$ can be as low as 4°C / 1,000 m.
- In Cold, Polar/Alpine Air ($T = -30^\circ\text{C}, q_s \text{ near zero}$): Very little moisture exists to condense. Consequently, latent heat release is negligible, and $\Gamma_s$ approaches the dry adiabatic rate of 9.8°C / 1,000 m.
- Standard Mid-Latitude Troposphere Average: Meteorologists typically use an average value of 6°C to 6.5°C / 1,000 m for saturated parcel ascents.
Quantifying Atmospheric Stability Regimes
Atmospheric stability is evaluated by comparing the ambient environment's actual measured cooling profile ($\text{ELR}$) to the adiabatic cooling profile of a theoretical air parcel ($\text{DALR}$ and $\text{SALR}$).
                     LAPSE RATE STABILITY COMPARISON GRAPH

      Altitude (z) ^
                   |      / (ELR: Absolutely Unstable > DALR)
                   |     /     / (DALR = 9.8°C/km)
                   |    /     /     / (ELR: Conditionally Unstable)
                   |   /     /     /     / (SALR ≈ 6°C/km)
                   |  /     /     /     /     / (ELR: Absolutely Stable < SALR)
                   | /     /     /     /     /
                   |/_____/_____/_____/_____/___> Temperature (T)
There are three primary stability regimes, plus atmospheric inversions:
1. Absolutely Stable Atmosphere ($\text{ELR} < \text{SALR} < \text{DALR}$)
- Condition: The environment cools more slowly with height than both the saturated and dry parcel rates (e.g., $\text{ELR} = 3^\circ\text{C/km}$).
- Physics: If a parcel is forcibly lifted (dry or wet), it cools faster than the surrounding air. At any altitude above its starting point, the parcel is colder and denser than its surroundings. Archimedes' principle exerts a downward restoring force.
- Weather Outcome: Convection is strictly suppressed. Air is calm, clear, or characterized by smooth stratiform clouds (fog, stratus).
2. Conditionally Unstable Atmosphere ($\text{SALR} < \text{ELR} < \text{DALR}$)
- Condition: The ambient lapse rate falls between the saturated rate and the dry rate (e.g., $\text{ELR} = 7.5^\circ\text{C/km}$).
- Physics:
- An unsaturated parcel lifted vertically cools at $\text{DALR} = 9.8^\circ\text{C/km}$, cooling faster than the environment ($\text{ELR} = 7.5^\circ\text{C/km}$). It remains negatively buoyant and will sink back if lifting stops (STABLE for dry air).
- However, if that parcel is forcibly lifted until it reaches saturation (LCL) and continues rising, it now cools at $\text{SALR} \approx 6^\circ\text{C/km}$. Because $\text{SALR} < \text{ELR}$, the parcel now cools slower than the surrounding air!
- Eventually, the parcel's temperature curve crosses the environmental temperature curve at the Level of Free Convection (LFC). Above the LFC, the parcel becomes warmer and lighter than the environment. It explodes upward on its own positive buoyancy without needing further external mechanical lift (UNSTABLE for saturated air).
- Weather Outcome: The most common state for severe weather, thunderstorms, and mountain convective clouds.
3. Absolutely Unstable Atmosphere ($\text{SALR} < \text{DALR} < \text{ELR}$)
- Condition: The environment cools faster with height than the dry adiabatic rate (e.g., $\text{ELR} > 9.8^\circ\text{C/km}$, known as a superadiabatic lapse rate).
- Physics: Any air parcel, dry or moist, lifted even slightly becomes immediately warmer than its surroundings and accelerates upward spontaneously.
- Weather Outcome: Extremely intense vertical mixing. Superadiabatic layers occur primarily near the ground on hot desert sunny afternoons, generating dust devils and aggressive thermals. In the free atmosphere, rapid mixing quickly restores the ELR back to neutral.
Summary Comparison Table of Atmospheric Stability Regimes
| Atmospheric Regime | Mathematical Condition | Behavior of Dry Parcel | Behavior of Saturated Parcel | Dominant Cloud Types |
|---|---|---|---|---|
| Absolutely Stable | $\text{ELR} < \text{SALR} < \text{DALR}$ | Negatively Buoyant (Sinks) | Negatively Buoyant (Sinks) | Clear, Stratus, Fog, Haze Layers |
| Moist Neutral | $\text{ELR} = \text{SALR}$ | Negatively Buoyant | Neutrally Buoyant | Nimbostratus, Continuous Rain Sheets |
| Conditionally Unstable | $\text{SALR} < \text{ELR} < \text{DALR}$ | Stable (Sinks) | Positively Buoyant above LFC | Cumulus congestus, Cumulonimbus |
| Dry Neutral | $\text{ELR} = \text{DALR}$ | Neutrally Buoyant | Positively Buoyant | Deep Mixed Boundary Layer |
| Absolutely Unstable | $\text{ELR} > \text{DALR}$ | Positively Buoyant | Positively Buoyant | Dust Devils, Violent Thermals, Microbursts |
| Temperature Inversion | $\frac{dT}{dz} > 0$ ($\text{ELR} < 0$) | Intensely Stable | Intensely Stable | Trapped Smog, Stratocumulus Cap |
Field Derivation: Calculating the Lifting Condensation Level (LCL)
The Lifting Condensation Level (LCL) is the altitude at which a surface parcel of air, lifted dry-adiabatically, becomes saturated ($RH = 100\%$).
As an unsaturated parcel rises:
1. Its temperature ($T$) decreases at the Dry Adiabatic Lapse Rate: $\Gamma_d \approx 9.8^\circ\text{C / 1,000 m}$.
2. Its dew point temperature ($T_d$), which depends on water vapor mass ratio and ambient pressure, decreases at a much slower rate known as the Dew Point Lapse Rate: $\Gamma_{td} \approx 1.8^\circ\text{C / 1,000 m}$.
The temperature-dewpoint spread (dewpoint depression, $T - T_d$) closes at a net rate of:
$$\Delta \Gamma = \Gamma_d - \Gamma_{td} = 9.8^\circ\text{C/km} - 1.8^\circ\text{C/km} = 8.0^\circ\text{C/km} \text{ (or } 8.2^\circ\text{C/km exact)}$$
To find the altitude $z_{\text{LCL}}$ (in meters above ground level) where $T(z) = T_d(z)$:
$$z_{\text{LCL}} = \frac{T_{\text{surface}} - T_{d,\text{surface}}}{\Delta \Gamma} \times 1000$$
Using $1000 / 8.0 = 125$:
$$z_{\text{LCL}} \approx 125 \times (T_{\text{surface}} - T_{d,\text{surface}}) \text{ meters}$$
Field Example:
If a weather station on a valley floor reports a surface temperature of $T = 28^\circ\text{C}$ and a dew point of $T_d = 16^\circ\text{C}$:
- Calculate dew point depression: $T - T_d = 28 - 16 = 12^\circ\text{C}$.
- Calculate cloud base height AGL: $z_{\text{LCL}} = 125 \times 12 = 1,500 \text{ meters AGL}$.
If the valley elevation is 400 m above sea level, the flat cloud bases will form precisely at $400 + 1,500 = 1,900 \text{ meters ASL}$.
Buoyancy, CAPE, and CIN Mechanics
Once an air parcel rises above the Level of Free Convection (LFC), its upward acceleration is governed by Archimedes' Buoyancy Principle. The vertical force per unit mass acting on the parcel is:
$$B = \frac{F_b}{m} = g \left( \frac{T_{v,\text{parcel}} - T_{v,\text{env}}}{T_{v,\text{env}}} \right)$$
where $T_v$ is the virtual temperature (a calculated temperature that accounts for moisture reducing air density).
                      CAPE AND CIN ON A STABILITY DIAGRAM

      Altitude (z) ^
                   |                 \         /  Parcel Trajectory
     Equilibrium   |-- EL ----------- \       /
        Level      |                   \  +  /  <--- CAPE (Positive Buoyancy)
                   |                    \   /        Parcel Warmer than Env
       Level of    |-- LFC --------------\-/---
   Free Convective |                      /     <--- CIN (Negative Buoyancy Cap)
                   |                     / \         Requires Mechanical Lift!
       Cloud Base  |-- LCL -------------/---\--
                   |                   /     \
      Surface (sfc)|------------------/-------\---> Temperature (T)
Integrating this buoyant force over vertical distances yields the two essential energy metrics of atmospheric convection:
1. Convective Available Potential Energy (CAPE)
CAPE represents the total positive kinetic energy that the atmosphere can impart to a rising saturated air parcel from the Level of Free Convection (LFC) up to the Equilibrium Level (EL):
$$\text{CAPE} = \int_{z_{\text{LFC}}}^{z_{\text{EL}}} g \left( \frac{T_{v,\text{parcel}}(z) - T_{v,\text{env}}(z)}{T_{v,\text{env}}(z)} \right) dz \quad [\text{J/kg}]$$
- CAPE < 300 J/kg: Weak potential; weak thermals or small cumulus.
- CAPE 1,000 - 2,500 J/kg: Moderate instability; strong thunderstorms capable of small hail.
- CAPE > 3,500 J/kg: Extreme instability; explosive updrafts ($> 40 \text{ m/s}$), capable of generating severe supercells, giant hail, and tornadoes.
2. Convective Inhibition (CIN)
CIN measures the amount of negative energy (the thermal "lid" or inversion cap) that a surface parcel must overcome to reach the LFC:
$$\text{CIN} = \int_{z_{\text{sfc}}}^{z_{\text{LFC}}} g \left( \frac{T_{v,\text{env}}(z) - T_{v,\text{parcel}}(z)}{T_{v,\text{env}}(z)} \right) dz \quad [\text{J/kg}]$$
A high CIN value ($> 200 \text{ J/kg}$) acts as an impenetrable barrier, capping surface thermals and suppressing storm formation even if CAPE above the cap is enormous. However, if surface heating or mountain lift erodes this CIN cap to near zero, the stored energy is released explosively. Detailed real-time soundings and CAPE analyses are available through the NOAA National Weather Service.
4. Practical Weather Forecasting, Cloud Morphology, & Outdoor Guidance
Cloud Taxonomy as Visual Thermodynamic Diagnostics
Clouds are visible manifestations of atmospheric thermodynamics. By identifying cloud morphology, an outdoor observer can diagnose the vertical lapse rate structure in real time without needing complex electronics. For official taxonomies, refer to the World Meteorological Organization (WMO) International Cloud Atlas.
                 CLOUD MORPHOLOGY AND STABILITY INDICATORS

     High (8km+)     ~~~~~~~~~~~~~~~~ Fibrous Cirrus Anvil ~~~~~~~~~~~~~~~~
                     (Tropopause Equilibrium Level: Parcel Heat Exhausted)
                                      ^
                                      | Updraft Core
     Mid (3-6km)     [ Altocumulus Castellanus ]    [ Cumulonimbus Incus ]
                     (Mid-level Instability)        (Severe Deep Convection)

     Low (0-2km)     [ Stratocumulus Sheet ]        [ Cumulus Congestus ]
                     (Trapped under Inversion)      (Unstable: Strong Updraft)
1. Trapped Stable Layers: Stratocumulus and Stratus
- Thermodynamic Profile: $\text{ELR} < \text{SALR}$. A strong temperature inversion sits directly above the cloud top.
- Visual Appearance: Uniform grey sheets or smooth, flat, roll-like cloud elements lacking sharp vertical turrets.
- Weather Prediction: No convection. Continuous light drizzle or persistent overcast; stable flight conditions for aviation; low visibility on mountain ridges.
2. Mid-Level Instability Precursors: Altocumulus Castellanus (ACCAS)
- Thermodynamic Profile: Conditionally unstable layer aloft ($4,000 - 6,000 \text{ m}$) separated from the surface by a dry, stable boundary layer.
- Visual Appearance: Small mid-level cloud rolls featuring miniature castle-like turrets or battlements sprouting vertically.
- Weather Prediction: Critical early warning sign. Indicates that mid-level lapse rates are becoming steep. If surface afternoon heating breaches the surface inversion cap later in the day, explosive thunderstorm development is virtually guaranteed.
3. The Convective Lifecycle: Cumulus Humilis to Cumulonimbus Incus
- Cumulus humilis (Fair-weather cumulus): Wider than they are tall. Indicates shallow convection stopped by a warm inversion layer near the LCL. Stable afternoon ahead.
- Cumulus mediocris: Vertical extent roughly equals horizontal width. Thermal updrafts are actively pushing through mid-levels.
- Cumulus congestus: Vertical height far exceeds horizontal base width. Sharp, crisp, bright white "cauliflower" top edges indicate intense, buoyant liquid water updrafts ($10 - 20 \text{ m/s}$). Instability is high ($\text{ELR} > \text{SALR}$).
- Cumulonimbus Incus: The top of the convective cloud loses its sharp cauliflower texture and becomes glaciated (fibrous, icy). Reaching the stable stratosphere (Tropopause Equilibrium Level), the updraft is flattened horizontally, forming a giant anvil (Incus). Indicates severe weather: torrential rain, lightning, hail, and damaging downburst winds.
Reading Skew-T Log-P Diagrams in the Field
Professional weather forecasters evaluate atmospheric lapse rates using Skew-T Log-P soundings—plots of temperature and dew point measured by radiosonde balloons launched twice daily worldwide. For field application guides, see the UK Met Office Weather Guide.
                 SIMPLIFIED SCHEMATIC OF A SKEW-T LOG-P SOUNDING

      Pressure (hPa)
        200 +---------------------------------------------------+  <- Tropopause
            |                         \                         |
        500 +--------------------------\--- Parcel Path --------+  <- Mid-Troposphere
            |                           \  / CAPE AREA          |
            |   Dewpoint Line (Td)       \/                     |
        700 +-------------\--------------/\                     |
            |              \            /  \ Environmental T    |
            |               \  CIN     /    \ Line              |
       1000 +----------------\--------/------\------------------+  <- Surface
           -20°C           -10°C     0°C    +10°C    +20°C   +30°C
Key Diagnostics for Outdoor Decision Making:
- Identify Inversions: Look for regions where the ambient temperature line (solid red/right line) tilts sharply to the right (warming with altitude). This represents a stable cap.
- Locate the LCL and LFC: Find where the theoretical surface parcel line crosses the dew point line (LCL) and where it crosses to the right of the environmental temperature line (LFC).
- Assess the CAPE Area: The wider the positive area between the parcel trajectory curve and the environmental temperature curve above the LFC, the more violent the potential thunderstorm updrafts.
- Inspect Wind Shear (Hodograph): Check wind speed and direction with height. Strong speed/directional shear turns convective cells into long-lived rotating supercells.
Practical Outdoor Applications & Safety Guidelines
A. Mountaineering & Alpine Hiking
- Summit Temperature Estimation: Never trust valley floor temperatures. Calculate mountain top conditions using lapse rates.
- Example: Valley base (500 m) is $25^\circ\text{C}$, dew point is $13^\circ\text{C}$ ($T - T_d = 12^\circ\text{C}$). Cloud base (LCL) is at $500 + (12 \times 125) = 2,000 \text{ m}$.
- To predict the summit temperature at 3,500 m:
- From 500 m to 2,000 m (unsaturated air), temperature drops at $\text{DALR} = 9.8^\circ\text{C/km}$:
$$\Delta T_1 = 1.5 \text{ km} \times 9.8^\circ\text{C/km} = 14.7^\circ\text{C} \implies T_{\text{LCL}} = 25 - 14.7 = 10.3^\circ\text{C}$$ - From 2,000 m to 3,500 m (inside cloud, saturated air), temperature drops at $\text{SALR} \approx 6.0^\circ\text{C/km}$:
$$\Delta T_2 = 1.5 \text{ km} \times 6.0^\circ\text{C/km} = 9.0^\circ\text{C} \implies T_{\text{summit}} = 10.3 - 9.0 = 1.3^\circ\text{C}$$
- From 500 m to 2,000 m (unsaturated air), temperature drops at $\text{DALR} = 9.8^\circ\text{C/km}$:
- Takeaway: While valley walkers enjoy shorts and t-shirts ($25^\circ\text{C}$), the summit climber faces near-freezing drizzle ($1.3^\circ\text{C}$).
B. Aviation, Paragliding, and Soaring
- Thermal Floor and Ceiling: Glider pilots rely on dry thermals below the LCL. The altitude of cloud base ($z_{\text{LCL}}$) marks the maximum height of unsaturated thermal climb.
- Cloud Suck Hazard: Under Cumulus congestus clouds, latent heat release inside the cloud creates intense localized low pressure directly beneath the cloud base. Paraglider pilots risk being violently sucked into the cloud interior by updrafts exceeding $15 \text{ m/s}$. If cloud tops turn fibrous or building speed exceeds $1 \text{ m/s}$ vertical growth per minute, exit the thermal immediately.
C. Wilderness Severe Weather Timing
- The 12:00 PM Rule of Thumb: In mountainous terrain during summer, convective instability peaks 2-4 hours after maximum solar heating starts. If Cumulus mediocris turrets appear before 10:00 AM, the atmosphere is dangerously unstable. Plan to be off exposed high-altitude ridges and summits by 12:00 PM.
5. Takeaway Box: Today's Meteorological Rule of Thumb
[!TIP]
🌤️ FIELD METEOROLOGY DECISION MATRIX
The 125-Meter Cloud Base Rule:
$$\text{Cloud Base Height AGL (meters)} \approx 125 \times (T_{\text{surface}} - T_{\text{dewpoint}})$$
(In Imperial Units: $\text{Cloud Base Height AGL (feet)} \approx 440 \times (T_{\text{surface}} - T_{\text{dewpoint}})^\circ\text{C}$)Lapse Rate Golden Values:
* Dry Adiabatic Lapse Rate ($\text{DALR}$) = $9.8^\circ\text{C / 1,000 m}$ ($5.5^\circ\text{F / 1,000 ft}$) — Fixed Physical Constant.
* Saturated Adiabatic Lapse Rate ($\text{SALR}$) $\approx 6.0^\circ\text{C / 1,000 m}$ ($3.3^\circ\text{F / 1,000 ft}$) — Variable with Temperature/Moisture.
* Standard Environmental Lapse Rate ($\text{ELR}$) $\approx 6.5^\circ\text{C / 1,000 m}$ ($3.5^\circ\text{F / 1,000 ft}$).Instability Quick Diagnostics:
* If $\text{ELR} < 6^\circ\text{C/km}$: Atmosphere is STABLE. Clear skies or flat stratiform sheets. No lightning threat.
* If $6^\circ\text{C/km} < \text{ELR} < 9.8^\circ\text{C/km}$: Atmosphere is CONDITIONALLY UNSTABLE. Watch for rapid vertical cloud growth if surface air is humid.
* If $\text{ELR} > 9.8^\circ\text{C/km}$: Atmosphere is ABSOLUTELY UNSTABLE. Explosive thermals, severe turbulence, microbursts.Visual Red Flag Warnings:
* Morning Altocumulus Castellanus (ACCAS) = Mid-altitude instability; thunderstorm threat later today.
* Crisp, Boiling Cauliflower Cloud Tops (Cumulus congestus) = Strong, active updraft ($> 10 \text{ m/s}$).
* Glaciated, Fibrous Anvil Top (Cumulonimbus incus) = Active severe storm; immediate risk of cloud-to-ground lightning, hail, and flash floods. Seek shelter immediately.
Authoritative References & External Documentation
- NOAA National Weather Service Glossary & Sounding Analysis
- World Meteorological Organization (WMO) International Cloud Atlas
- UK Met Office: Atmospheric Stability and Weather Forecasting Guides
- Wikipedia: Detailed Physics of Environmental and Adiabatic Lapse Rates
- MIT OpenCourseWare: Thermodynamics of the Atmosphere & Ocean Dynamics