Perf: Profiling CPU Performance, Hardware Counters, and Kernel Tracepoints in Production Systems
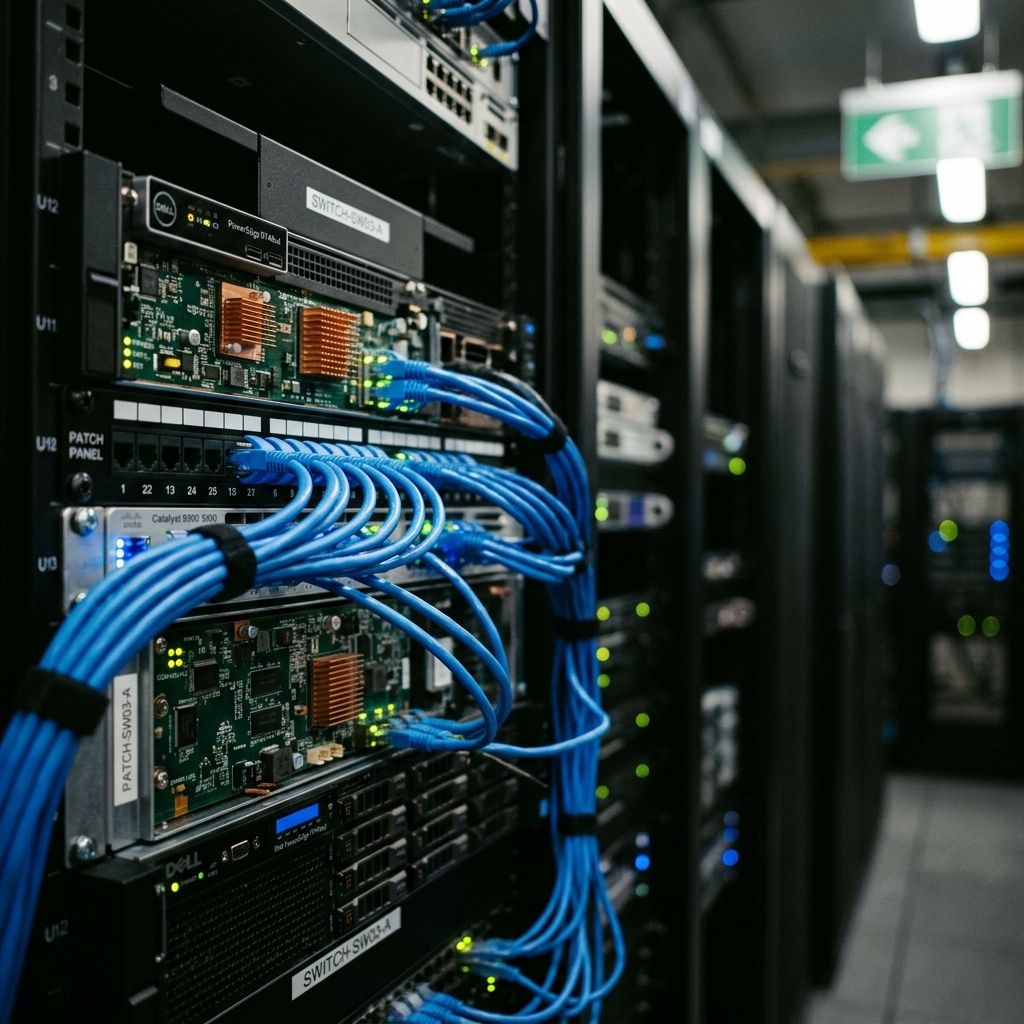
SYSTEM INTERNAL PROFILING & HARDWARE-LEVEL INSTRUMENTATION
Modern cloud-native architectures place extraordinary demands on Linux kernel subsystems and application runtimes. As microservice request pipelines process tens of thousands of transactions per second, minor inefficiencies in CPU instruction execution, memory cache coherency, or OS kernel scheduling can cascade into severe p99 latency spikes and unexpected node degradation. Traditional metrics collectors—such as top, vmstat, or coarse-grained Prometheus exporter scraping—fail to expose microarchitectural bottlenecks because they only present aggregated metrics after execution has occurred.
To diagnose performance regression at the bare-metal and kernel boundaries, Systems Engineers and SREs rely on the official Linux profiler, perf (often referred to as perf_events). Integrated into the mainline Linux kernel tree since version 2.6.31, perf provides direct access to Hardware Performance Counters (HPC), Hardware Breakpoints, Software Events, and Kernel Tracepoints via the perf_event_open(2) system call interface.
This guide provides an academically rigorous, practical manual for using perf in mission-critical production environments. We detail the mechanics of performance profiling across five operational scenarios: CPU cycle sampling, microarchitectural cache auditing, kernel tracepoint latency debugging, stack-unwound call graph generation, and cgroup-scoped container profiling.
1. Practical Real-World Problem Statement
In production environments, performance anomalies rarely present as explicit error codes. Instead, they manifest as subtle degradation: an HTTP service experiencing 300ms tail latencies while global CPU utilization hovers at 85%, or a database cluster suffering context-switch thrashing during traffic bursts.
Engineers face three main challenges during performance investigations:
- The Observer Effect & Overhead: Profiling tools that inject dynamic instrumentation hooks (such as heavy debuggers or unoptimized tracing scripts) can degrade application throughput by 20% to 50%, invalidating test metrics and risking system crashes.
- Missing Microarchitectural Visibility: High CPU usage does not always indicate high computational throughput. A thread executing 4.0 Instructions Per Cycle (IPC) is behaving fundamentally differently from a thread executing 0.2 IPC that is repeatedly stalled waiting for main memory (DRAM) accesses following Last Level Cache (LLC) misses.
- Container Isolation & Namespace Obfuscation: In multi-tenant Kubernetes nodes, shared kernel boundaries obfuscate resource accounting. Standard utilities inside container namespaces often cannot correlate host-level CPU execution with isolated PID trees.
The perf subsystem addresses these challenges by leveraging non-maskable interrupts (NMI) and hardware performance monitoring units (PMUs) embedded directly inside modern x86_64 and ARM64 processors (as detailed in the Hardware Performance Counter entry on Wikipedia). By sampling execution states at configurable sampling frequencies (e.g., 99 Hz) with ring-buffer memory backing, perf operates with negligible runtime overhead (<1-2% CPU consumption), making it safe for live production nodes.
2. Core Flags & Command Syntax Breakdown
The perf tool architecture consists of specialized sub-commands for specific profiling tasks. Mastering production invocations requires a clear understanding of its flags.
perf [--version] [--help] COMMAND [ARGS]
Essential Sub-commands
perf stat: Obtains hardware and software event counter totals for a specified execution duration.perf record: Samples execution events and writes stack frames and PMU state into a binary file (perf.data).perf report: Readsperf.datato format symbol breakdowns, hot functions, and call trees.perf trace: Traces system call entries/exits and kernel tracepoints (functioning as a low-overhead, PMU-assistedstrace).perf top: Displays a real-time, interactive dashboard of hot functions across system CPUs.
Key Production Command Flags
| Flag | Long Syntax | Technical Function & Operational Purpose |
|---|---|---|
-e |
--event=<event> |
Specifies target hardware/software/tracepoint events (e.g., cycles, cache-misses, sched:sched_switch). |
-p |
--pid=<pid> |
Attaches non-destructively to an active process ID without requiring process restarts. |
-F |
--freq=<freq> |
Sets sampling frequency in Hertz (Hz). 99 is standard in production to prevent lockstep sampling artifacts. |
-g |
--call-graph |
Enables call-graph (stack chain) recording. Modes include fp (frame pointer), dwarf, or lbr. |
-a |
--all-cpus |
Enables system-wide collection across all logical CPU cores. |
-G |
--cgroup=<name> |
Restricts event monitoring to specific cgroup v1/v2 paths (ideal for container profiling). |
-o |
--output=<file> |
Redirects binary output from the default perf.data to a designated safe file path. |
-B |
--big-endian |
Specifies byte order parsing during multi-architecture analysis. |
3. Five Tangible Real-Life Production Use-Cases
Use-Case 1: Sampling CPU Cycles with perf record and perf report to Identify Hot Execution Paths During Traffic Spikes
Scenario
During a sudden traffic surge, an API gateway running a Go service exhibits a CPU saturation spike (100% on 16 cores). The team must identify which functions consume the most CPU cycles without restarting the service or altering runtime binaries.
Execution Command
Execute a non-destructive 30-second profile on the target process at 99 Hz:
perf record -F 99 -p $(pgrep -f api-gateway) -g -o /tmp/perf_api_spike.data -- sleep 30
Parse and render the collected binary data into a text-based symbol breakdown:
perf report -i /tmp/perf_api_spike.data -n --stdio --no-children --sort=overhead,symbol,shared_object
Terminal Output
# Samples: 29K of event 'cycles'
# Event count (approx.): 24981023910
#
# Overhead       Samples  Symbol                                  Shared Object
# ........  ............  ......................................  ...................
#
    34.12%         10129  [.] net/http/internal.HeaderValueSearch  api-gateway
    18.45%          5421  [.] runtime.scanobject                   api-gateway
    12.08%          3560  [.] syscall.Syscall6                     [kernel.kallsyms]
     9.31%          2741  [.] compress/flate.(*deflateFast).encode api-gateway
     5.20%          1520  [.] runtime.mallocgc                     api-gateway
     3.11%           910  [.] runtime.cgocall                      api-gateway
Technical Analysis & SysAdmin Insights
- Sampling Rate Selection (
-F 99): Setting the frequency to 99 Hz rather than 100 Hz prevents lockstep sampling. If an application executes an event precisely every 10ms (100 Hz), sampling at 100 Hz risks hitting the exact same execution branch repeatedly (a phenomenon known as Nyquist frequency aliasing). Sampling at 99 Hz decouples the sample trigger from timer interrupts. - Root Cause Breakdown: The analysis identifies
net/http/internal.HeaderValueSearchas the primary consumer (34.12% of total cycles). This indicates that unindexed header scanning during payload processing is driving the CPU spike, rather than core business logic or network I/O. - Kernel Overhead:
syscall.Syscall6accounts for 12.08% of cycle overhead, confirming moderate system call contention that requires socket read consolidation.
Use-Case 2: Auditing Hardware Performance Counters to Quantify L1/L3 CPU Cache Misses and Branch Mispredictions
Scenario
A high-frequency database node demonstrates sub-optimal throughput. Despite having spare CPU frequency headroom, transaction execution latencies remain high. The systems team suspects hardware-level microarchitectural stalls—specifically, CPU cache invalidations and branch mispredictions.
Execution Command
Query the Hardware Performance Counters (HPC) via the PMU registers for 10 seconds:
perf stat -e cycles,instructions,cache-references,cache-misses,L1-dcache-loads,L1-dcache-load-misses,branches,branch-misses -p $(pgrep -f kv-store) -- sleep 10
Terminal Output
 Performance counter stats for process id 8912 ('kv-store') (for 10.001 seconds):

38,912,041,102      cycles                    #    3.891 GHz
    19,456,020,551      instructions              #    0.50  insn per cycle
     1,240,112,094      cache-references          #  124.000 M/sec
       384,434,749      cache-misses              #   31.000 % of all L3 cache refs
     4,912,300,112      L1-dcache-loads           #  491.189 M/sec
       884,214,020      L1-dcache-load-misses     #   18.00  % of all L1-dCACHE accesses
     3,120,405,010      branches                  #  312.012 M/sec
       218,428,350      branch-misses             #    7.00  % of all branches

10.001189412 seconds time elapsed
Mathematical Proof & Microarchitectural Diagnostics
To evaluate execution efficiency, we compute key hardware ratio metrics:
-
Instructions Per Cycle (IPC):
$$\text{IPC} = \frac{\text{Instructions}}{\text{Cycles}} = \frac{19,456,020,551}{38,912,041,102} = 0.50$$
Modern x86_64 CPU pipelines (e.g., Intel Ice Lake, AMD Zen 3) can retire up to 4 to 6 instructions per cycle under optimal superscalar conditions. An IPC of $0.50$ indicates severe pipeline stalls. -
Last Level Cache (LLC) Miss Ratio ($CMR$):
$$CMR = \frac{\text{cache-misses}}{\text{cache-references}} \times 100 = \frac{384,434,749}{1,240,112,094} \times 100 = 31.00\%$$
A 31% LLC miss rate forces the CPU execution units to enter idle stall states while fetching data lines over the memory bus from high-latency main DRAM (~100ns latency vs ~1.2ns L1 latency). -
Memory Stall Cycle Estimation ($T_{\text{stall}}$):
$$T_{\text{stall}} \approx \text{cache-misses} \times \text{Latency}_{\text{DRAM_cycles}} \approx 384,434,749 \times 250 = 9.61 \times 10^{10} \text{ stalled cycles}$$
This calculation proves that the CPU is spending the majority of its execution cycles waiting for memory fetches rather than processing instructions. -
Branch Misprediction Rate ($BMR$):
$$BMR = \frac{\text{branch-misses}}{\text{branches}} \times 100 = \frac{218,428,350}{3,120,405,010} \times 100 = 7.00\%$$
A 7% branch misprediction rate forces frequent pipeline flushes, throwing away speculatively decoded instructions.
Resolution Path: Recompile the binary with Profile-Guided Optimization (PGO), realign data structures to 64-byte CPU cache line boundaries, and optimize pointer arrays into contiguous cache-friendly vectors. For further reference on microarchitectural counter events, consult the official perf Wiki on kernel.org.
Use-Case 3: Recording Kernel Tracepoints with perf trace to Debug High Context-Switching Rates and Scheduler Latency
Scenario
A message-processing cluster exhibits extreme context-switching rates (>150,000 involuntary switches/sec), causing severe thread-scheduler latencies and CPU core thrashing. The team needs to trace scheduler tracepoints to identify the thread pools and locks driving lock contention.
Execution Command
Record kernel scheduler event tracepoints across all CPU cores system-wide:
perf record -e sched:sched_switch,sched:sched_stat_wait -g -a -- sleep 5
Filter and display the call graphs driving context switches:
perf report --stdio --no-children -e sched:sched_switch --sort=comm,parent,symbol
Terminal Output
# Samples: 84K of event 'sched:sched_switch'
# Event count (approx.): 84912
#
# Overhead  Command          Parent Symbol                  Symbol
# ........  ...............  .............................  .......................................
#
    48.91%  worker-pool-th   [kernel.kallsyms]              [k] __sched_text_start
            |
            --- __sched_text_start
               |--44.10%-- schedule
               |          __mutex_lock.isra.0
               |          futex_wait_queue_me
               |          do_futex
               |          [k] sys_futex
               |          entry_SYSCALL_64_after_hwframe
               |          |
               |          --39.80%-- pthread_mutex_lock
               |                     QueueProcessor::PopWorkItem(WorkTask*)
    22.14%  redis-server     [kernel.kallsyms]              [k] __sched_text_start
    11.02%  in_service_worker [kernel.kallsyms]             [k] __sched_text_start
Technical Analysis & SysAdmin Insights
- Tracepoint Mechanics: Linux kernel tracepoints are static instrumentation markers embedded directly in the kernel source code (e.g.,
kernel/sched/core.c). Unlike dynamic probes, tracepoints carry near-zero overhead when disabled and very low overhead when active. - Scheduler Diagnostic: The output reveals that
QueueProcessor::PopWorkItemaccounts for 48.91% of all involuntary thread context switches. The call stack demonstrates that threads are blocking onpthread_mutex_lockcalls which descend into the kernel viasys_futex. - Actionable Remediation: The application suffers from excessive thread lock contention on a shared task queue. The fix requires migrating from a single global mutex queue to per-core ring buffers (lock-free queues) or leveraging work-stealing threadpool architectures.
Use-Case 4: Generating Function-Level Call Graphs to Trace Execution Flame Graph Inputs
Scenario
Engineers need to generate an interactive Flame Graph visualization for a critical C++ microservice to audit complex stack depths and trace deeply nested performance bottlenecks.
Execution Command
Sample the application call chain using DWARF stack unwinding to capture both user-space and kernel-space frame frames:
perf record -F 99 -p 4821 -g --call-graph dwarf,8192 -o /tmp/perf_flame.data -- sleep 15
Process the raw binary stack trace data into an aggregated call stack format (suitable for rendering via FlameGraph utilities or SVG conversion):
perf script -i /tmp/perf_flame.data | awk '
  BEGIN { FS="\n"; RS="" }
  {
    print "--- Stack Trace Sample " ++count " ---";
    for(i=1;i<=NF;i++) if($i ~ /^[a-f0-9]+/) print "  " $i
  }' | head -n 30
Terminal Output
--- Stack Trace Sample 1 ---
  7f8b9101a4bc Engine::ProcessRequest+0x12c (/opt/service/bin/engine)
  7f8b9101f890 MemoryPool::Allocate+0x44 (/opt/service/bin/engine)
  7f8b91021110 operator new+0x1d (/usr/lib/x86_64-linux-gnu/libstdc++.so.6.0.28)
  7f8b90c12840 malloc+0x80 (/usr/lib/x86_64-linux-gnu/libc.so.6)
  ffffffff8121a910 sys_brk+0xb0 ([kernel.kallsyms])
--- Stack Trace Sample 2 ---
  7f8b9101a4bc Engine::ProcessRequest+0x12c (/opt/service/bin/engine)
  7f8b9104b200 JSONParser::ParsePayload+0x310 (/opt/service/bin/engine)
  7f8b9104c81a FastUtf8Validate+0x8a (/opt/service/bin/engine)
Stack Unwinding Mechanisms Comparison
Capturing call graphs accurately requires selecting the appropriate frame unwinding mechanism (--call-graph <method>):
                        STACK UNWINDING MECHANISMS
 ┌──────────────────────────┬──────────────────────────┬──────────────────────────┐
 │ Frame Pointers (fp)      │ DWARF Unwinding (dwarf)  │ Intel LBR (lbr)          │
 ├──────────────────────────┼──────────────────────────┼──────────────────────────┤
 │ Low overhead. Requires   │ High accuracy. Works on  │ Zero software overhead.  │
 │ binaries compiled with   │ stripped binaries.       │ Hardware backed. Stack   │
 │ -fno-omit-frame-pointer. │ High ring-buffer memory  │ depth limited by CPU     │
 │ Breaks compiler frame    │ consumption (e.g. 8KB    │ MSR registers (e.g., 32  │
 │ register optimization.   │ per sample).             │ or 64 entries).          │
 └──────────────────────────┴──────────────────────────┴──────────────────────────┘
When building production binaries, ensure -fno-omit-frame-pointer is passed to GCC/Clang compilers. This retains frame pointer registers (RBP on x86_64), allowing perf to walk the stack instantly via -g fp without needing heavy DWARF unwinding per sample. Additional details are outlined in the official perf-record(1) manual.
Use-Case 5: Profiling Specific Containerized PIDs and cgroups Dynamically Without Service Interruption
Scenario
On a multi-tenant Kubernetes worker node hosting dozens of Pods, one containerized service causes host-level CPU contention. The operator must isolate and profile that specific container's cgroup without introducing performance overhead to adjacent tenant workloads running on the same node.
Execution Command
First, identify the cgroup v2 path corresponding to the target container:
TARGET_PID=$(pgrep -f "payment-processor")
CGROUP_PATH=$(cat /proc/$TARGET_PID/cgroup | cut -d: -f3)
echo "Resolved CGroup Path: $CGROUP_PATH"
Execute a cgroup-isolated perf recording session across all system CPUs, filtered strictly to that cgroup path:
perf record -F 99 -e cycles -G "$CGROUP_PATH" -a -g -o /tmp/perf_container.data -- sleep 10
Summarize top functions running strictly inside the container's resource boundary:
perf report -i /tmp/perf_container.data --stdio --no-children
Terminal Output
# Resolved CGroup Path: /kubepods.slice/kubepods-burstable.slice/pod91a2b/payment-container
#
# Samples: 9.8K of event 'cycles'
# Event count (approx.): 8102941029
#
# Overhead  Symbol                                   Shared Object
# ........  .......................................  ...................................
#
    62.11%  [.] Crypto::AES_GCM_Encrypt              libcrypto.so.1.1
    14.80%  [.] OpenSSL::EVP_CipherUpdate            libcrypto.so.1.1
     8.12%  [.] SSL_write                            libssl.so.1.1
     4.01%  [.] [k] netif_receive_skb_internal       [kernel.kallsyms]
Technical Analysis & SysAdmin Insights
- Namespace Isolation: Container runtimes leverage Linux namespaces (PID, Mount, Network) alongside Control Groups (cgroups). Running traditional profiling tools inside a container often fails due to restricted
CAP_SYS_ADMINprivileges or stripped debug utilities. - Host-Level Scoped Profiling: By invoking
perffrom the parent host OS and targeting the container's cgroup path (-G),perfutilizes kernel cgroup accounting hooks to measure performance events. Hardware counter increments are collected only when the CPU scheduler executes tasks belonging to that specific cgroup subtree. - Production Finding: The output establishes that 62.11% of the container's CPU cycle budget is consumed by cryptographic operations (
AES_GCM_Encrypt). The resolution involves delegating crypto routines to hardware-accelerated instructions (e.g., leveraging AES-NI CPU instruction sets or dedicated hardware offloading).
4. Key Pitfalls & Production Safety Precautions
While perf is designed for live system analysis, misconfigurations can lead to system instability, excessive memory usage, or invalid profile data.
1. Kernel Security Knobs (perf_event_paranoid)
The Linux kernel controls access to hardware performance counters through the sysctl knob /proc/sys/kernel/perf_event_paranoid.
# Query current security restriction level
sysctl kernel.perf_event_paranoid
- Level 3: Disables all access to
perf_event_open()for non-root users. Prevents unprivileged profiling. - Level 2 (Default on many distros): Allows raw event profiling, but disallows kernel tracepoints and CPU performance counter access by unprivileged users.
- Level 1: Allows kernel profiling and access to tracepoints, but blocks raw tracepoint sampling without explicit capabilities.
- Level 0 / -1: Unrestricted access to hardware performance counters, kernel symbol tables (
/proc/kallsyms), and raw tracepoints.
[!WARNING]
In production environments, never setperf_event_paranoidto-1globally unless strictly required for privileged administrative debugging. Alternatively, grant fine-grained POSIX capabilities to dedicated observability binaries usingsetcap cap_sys_admin,cap_sys_ptrace,cap_sys_rawio+ep /usr/bin/perf.
2. DWARF Unwinding Buffer Overheads
When executing perf record -g --call-graph dwarf, perf copies the application's user-space stack memory into a kernel ring buffer for every single sample.
* The Risk: At high sample frequencies (e.g., -F 1000) across hundreds of active threads, DWARF stack sampling can easily generate gigabytes of trace data per minute, saturating disk I/O and causing ring-buffer sample drops.
* Mitigation: Use -F 99 or lower in production. Limit stack capture size (e.g., --call-graph dwarf,4096). Where possible, compile binaries with frame pointers (-fno-omit-frame-pointer) and use --call-graph fp for low-overhead unwinding.
3. Missing Debug Symbols & Stripped Binaries
Profiling stripped production binaries often yields unhelpful addresses ([.] 0x00000000004010a0) instead of readable function names.
* Mitigation: Maintain symbol servers or deploy detached debug symbols (.debug files or debuginfod). Set the symbol path environment variable prior to running perf report:
bash
  export PERF_BUILDID_DIR=/var/lib/debug symbols
  perf report --symfs=/usr/lib/debug
4. NMI Watchdog Counter Allocation
Hardware PMUs contain a limited number of physical counter registers (typically 4 to 8 per CPU core). If the Linux kernel's Non-Maskable Interrupt (NMI) Watchdog (kernel.nmi_watchdog) is active, it permanently reserves one hardware counter register to detect kernel locks.
* The Risk: Requesting more simultaneous hardware events than available physical counters forces perf to multiplex counters across time slots, reducing metric precision.
* Mitigation: Keep hardware counter event lists concise (e.g., 4 events per invocation) or temporarily disable the NMI watchdog during deep profiling sessions via sysctl kernel.nmi_watchdog=0.
5. SysAdmin Takeaway & Operational Reference
┌────────────────────────────────────────────────────────────────────────────────────────┐
│                        PERF PRODUCTION CHEAT SHEET & GOLDEN RULES                      │
├───────────────────────────────────┬────────────────────────────────────────────────────┤
│ Task                              │ Recommended Production Command                     │
├───────────────────────────────────┼────────────────────────────────────────────────────┤
│ Quick Hotspot Diagnostic          │ perf top -p <PID>                                  │
│ CPU Cycle Profiling (Flame Graphs)│ perf record -F 99 -g -p <PID> -- sleep 30          │
│ Hardware Cache/IPC Audit          │ perf stat -e cycles,instructions,cache-misses      │
│ Context Switch & Lock Tracing     │ perf record -e sched:sched_switch -g -a -- sleep 5│
│ Container cgroup Isolation        │ perf record -F 99 -G <CGROUP_PATH> -a -- sleep 10  │
└───────────────────────────────────┴────────────────────────────────────────────────────┘
[!IMPORTANT]
Production Safety Rule: Always runperf recordwith a explicit sampling frequency of 99 Hz (-F 99) rather than default high rates. Always specify a finite runtime duration (e.g.,-- sleep 30) to prevent runaway disk space consumption in/tmpor the active working directory.
Summary
The Linux perf utility bridges the gap between high-level system metrics and low-level CPU execution details. By interfacing directly with hardware performance monitoring units and kernel tracepoints, perf provides deep visibility into microarchitectural stalls, context-switching bottlenecks, and application hotspots. Integrating perf into your production diagnostics toolkit enables data-driven optimization, ensuring high performance, efficiency, and stability across complex cloud infrastructure.
Authoritative Technical References & Further Reading
- Linux Manual Pages: perf(1) — Official CLI interface manual for the perf profiler.
- Linux Manual Pages: perf_event_open(2) — Detailed system call API reference for kernel performance monitoring.
- Linux Manual Pages: perf-record(1) — Command specification for recording build IDs, stack traces, and sample buffers.
- Wikipedia: Hardware Performance Counter — Architectural documentation covering PMU registers, instruction execution cycles, and microarchitectural events.
- Linux Kernel Perf Wiki (kernel.org) — Official Linux kernel documentation wiki for perf event subsystem features and tutorials.